


Macro & Market Views
The Small Idea: The Waiting Is the Hardest Part
The Small Idea: The Waiting Is the Hardest Part
As First Eagle’s Small Cap team approaches its three-year anniversary, I wanted to take a look back at the performance of our investment universe since we joined the firm in April 2021. In short, small caps failed to deliver the additional reward relative to large caps that has defined their history.
This edition of The Small Idea was written by Bill Hench, head of the Small Cap team and portfolio manager.
Though smaller stocks were strong early in our tenure and have since demonstrated transient periods of renewed enthusiasm, there is little to celebrate in the small cap space for the period as a whole. The Russell 2000 Index rallied sharply off Covid-19 lows to reach an all-time high in early November 2021 before selling off sharply across the next year or so, losing around 35% from peak to trough.1 While the S&P 500 Index followed a similar trajectory through this challenging period, the magnitude of its loss was far less and its subsequent rebound far greater. As shown in Exhibit 1 on the following page, these dynamics have resulted in large stocks outperforming small by 38% since we joined First Eagle.
Macroeconomic factors both positive—the continued strength of the US economy—and negative—above-target inflation, higher-for-longer interest rates, potential recession, challenging geopolitics and massive sovereign debt levels—would seem likely to have a capitalization-agnostic impact. Despite this, the Russell 2000 has been range-bound for much of the past two years, and the surge in other parts of the US equity market comes as cold comfort for those of us earning our keep wresting returns from small cap stocks.
Exhibit 1. Small Cap Stocks Have Lagged Large Cap Names Significantly in Recent Years
Percent Change Based on Price Returns, April 2021 through February 2024
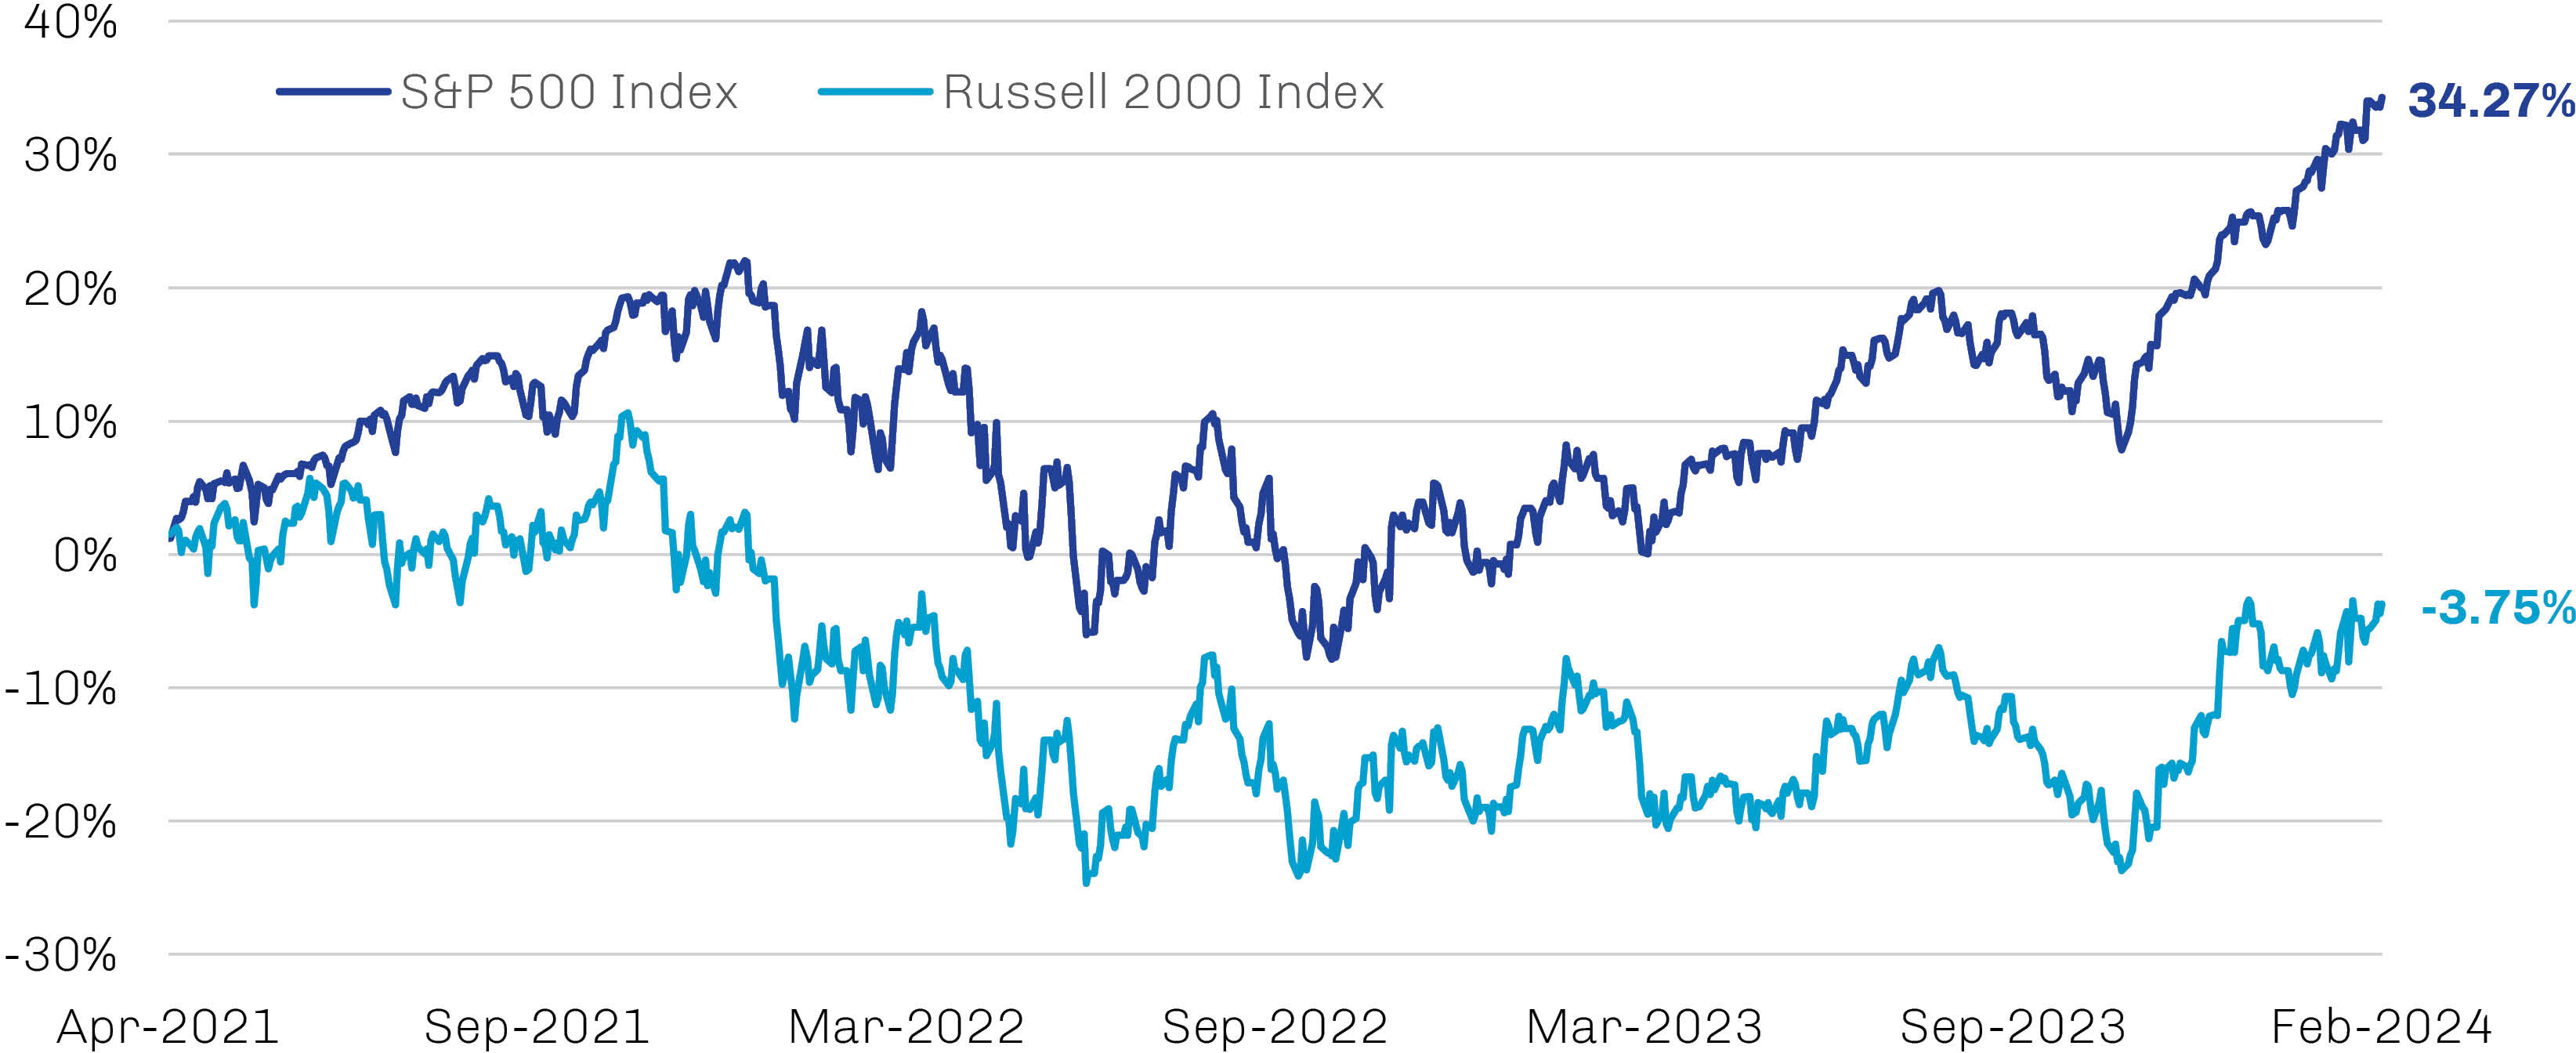
Source: FactSet; data as of February 29, 2024.
Past performance is not indicative of future results.
Chart is for illustrative purposes only.
Patience Is a Virtue
So, why the huge performance gap between large and small stocks? While certain idiosyncratic developments may have played a role—the mania around artificial intelligence helped drive returns of the aptly named Magnificent Seven,2 for example, while regional bank turmoil in March 2023 had an outsized impact on small stocks—our guess is that the root of the large/small divergence lies in policy decisions.
Perhaps the current environment is the legacy of crisis-era measures—in response both to the global financial and Covid-19 crises—that broke all policy conventions in an effort to forestall pain. Super-accommodative monetary policies, including the magic of zero interest rates, resulted in a handful of companies whose market caps have soared to heights previously unimagined. If history is any guide, however, pronounced valuation disparities tend to revert to the mean over time. As shown in Exhibit 2, deep depressions in small cap valuations typically have been followed by pronounced and often lengthy rallies.
Exhibit 2. Small Caps Appear Cheap Compared to Large Caps and to Their Own History
Trailing Price-to-Earnings Multiples, January 2004 through February 2024
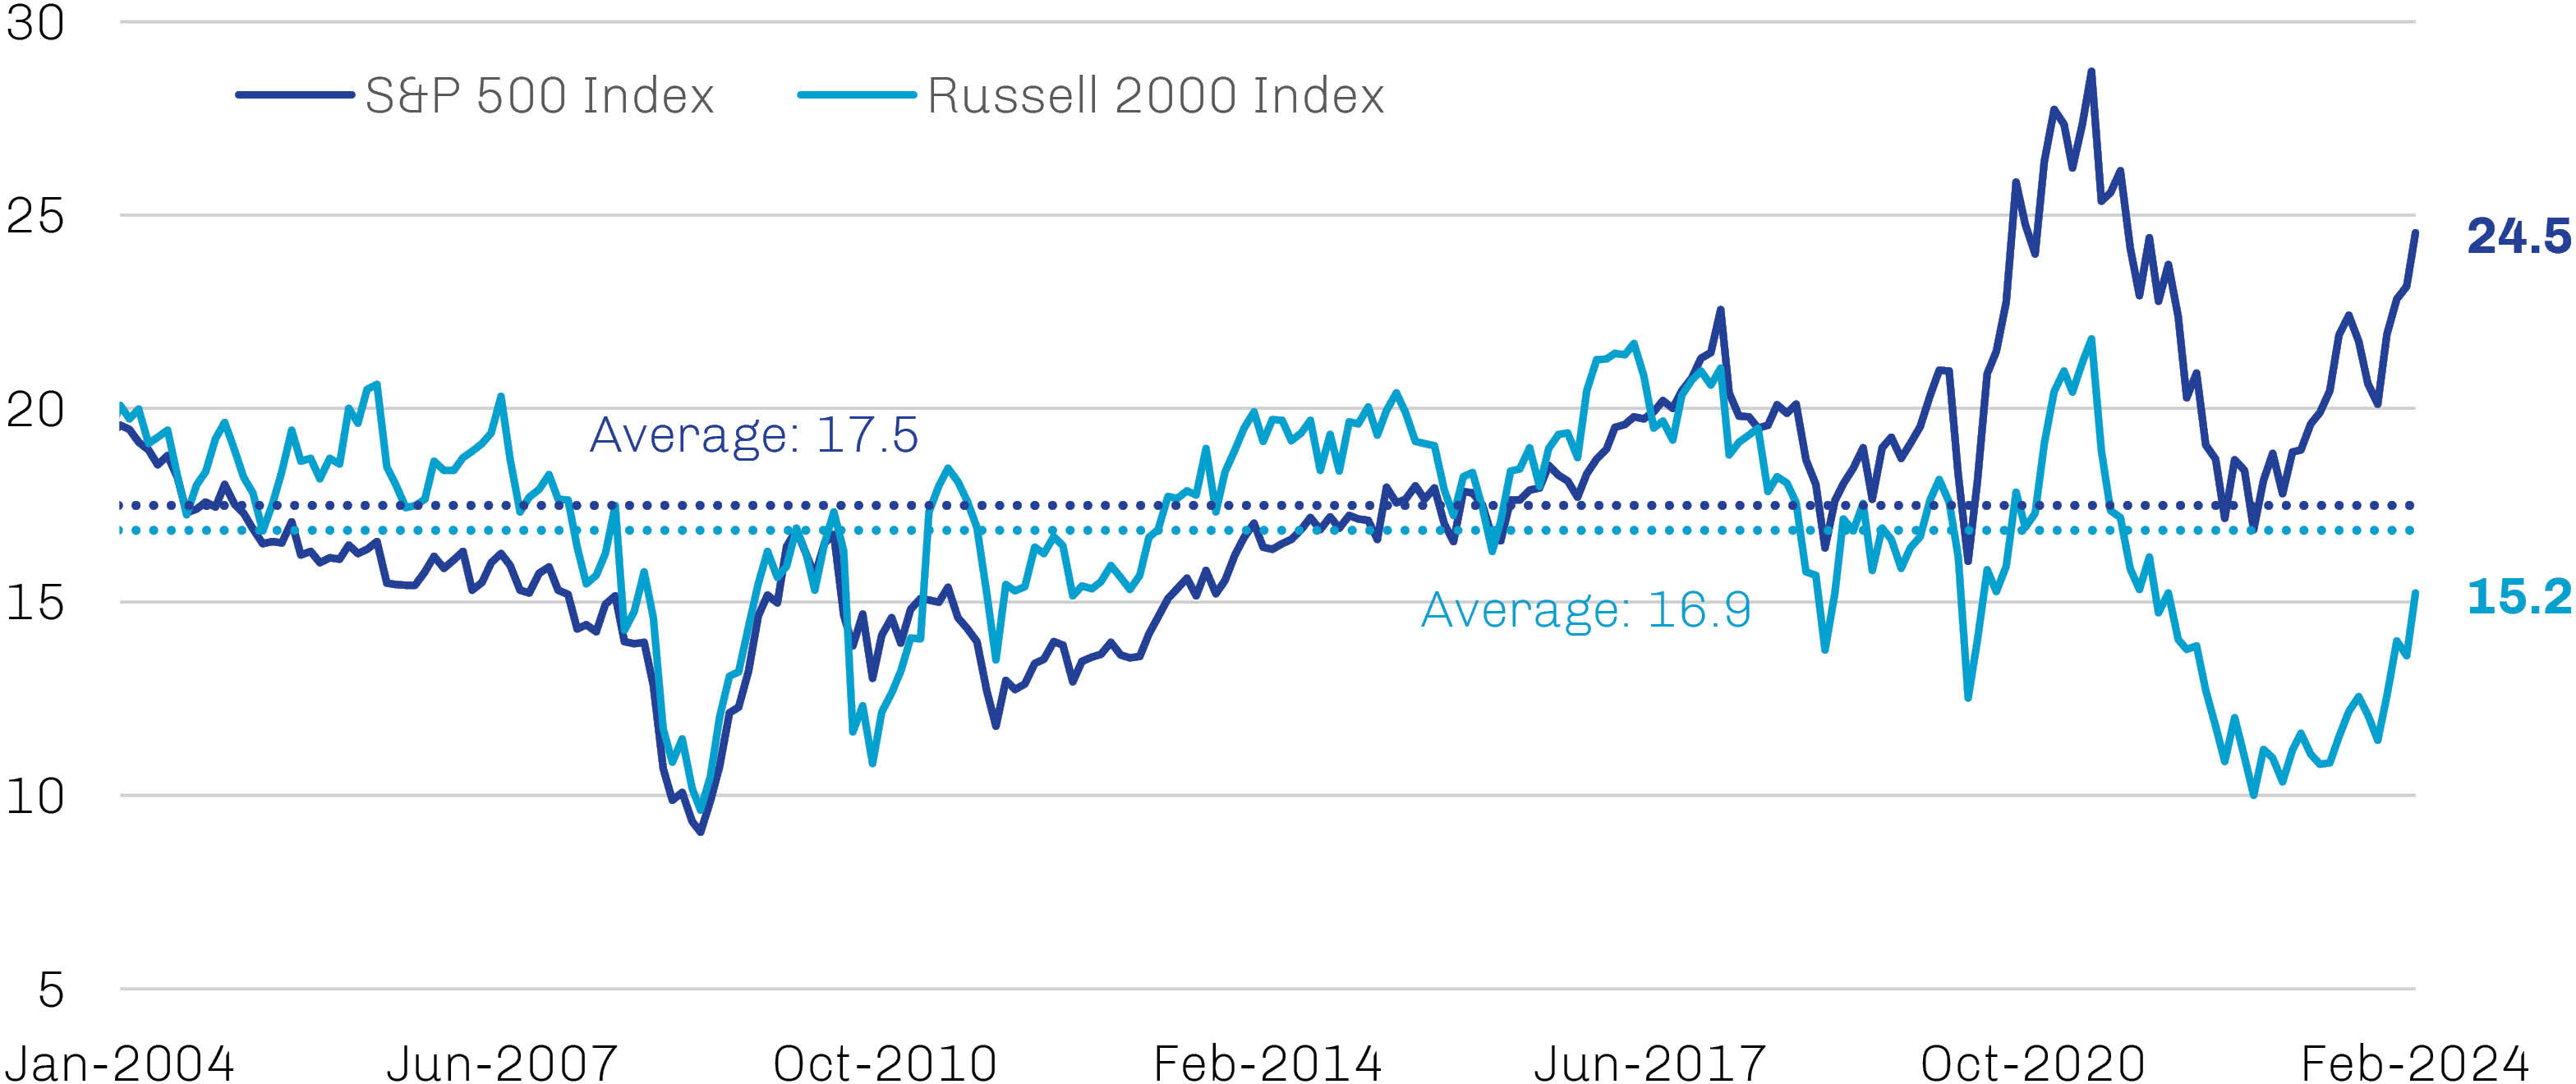
Source: FactSet; data as of February 29, 2024.
Past performance is not indicative of future results.
Chart is for illustrative purposes only.
If the chasm in relative valuations is attributable to twenty-first-century policy experiments, shouldn’t mean reversion be right around the corner with central bank normalization is well underway? Maybe, or maybe not; getting back to even can take time. I’m old enough to remember that the Nasdaq took 15 years to regain its 2000 high once the tech bubble burst, and the index proceeded to more than triple over the next nine years.3 Similarly, US home prices took about a decade to recapture the 2006 peak that was lost amid the global financial crisis.4 That said, we expect the scars from money printing and zero interest rate policies will eventually fade.
Valuations—especially among smaller stocks and their indexes—ebb and flow. Unable to call a shift in tides, we focus on what we control: which stocks to buy and how much to pay for them.
Recall that small cap stocks have been the most rewarding segment of the equity market going back to 1927.5 While this most recent period of sideways performance has been frustrating, the underlying volatility that characterizes small caps has provided opportunity to probe beneath the surface for good companies at what we believe are compelling prices; historically, such temporal market inefficiencies have provided opportunity for skilled active managers of small cap portfolios to outperform indexes.6
We believe that skillful adherence to disciplined processes, focused on fundamental research and valuation, should ultimately give small cap investors the potential to be paid for taking the risks inherent to this special segment of the market. Increased merger and acquisition activity as interest rates stabilize, combined with more smaller companies coming public, could amplify rewards. Patience may ultimately be rewarded.