


Macro & Market Views
Separating the Wheat from the Chaff
Separating the Wheat from the Chaff
Key Takeaways

Though roiled by the discord surrounding regional banks earlier in 2023, small cap stocks rallied sharply in November and December to deliver a strong annual return.
The prospect of easier monetary conditions and a turning point in the business cycle could serve as a tailwind for small cap shares in 2024, but we believe that trying to anticipate policy changes is a poor foundation for investment success.
Valuations for small cap shares are below their own historical averages and relative to their large cap counterparts. While some reversion to long-term means could help small stocks, in our view, passive index exposure is unlikely to be a path to optimal returns in what is a particularly inefficient market.
We believe investors ultimately may be rewarded for buying good companies at low prices, a strategy that historically has provided opportunities for active investors to outperform indexes.1
While small caps missed out on a powerful midyear rally concentrated in a handful of very large tech-related names, market performance broadened into year-end on hopes of a dovish pivot by the Federal Reserve. This change in sentiment more than offset what had been year-to-date losses for the small cap universe while also highlighting the volatility so common in the space.
Easier monetary conditions are widely anticipated for 2024 and could provide tailwinds for smaller stocks. So, too, could a reversion toward long-term relative valuation means for a market segment trading at a significant discount to both its own historical valuation and that of large caps. Of course, these developments are by no means guaranteed; in fact, only a few weeks into the new year, markets have already begun to temper their 2024 rate-cut expectations.
We recognize that top-down forecasting is beyond our scope and instead focus on identifying quality companies with catalysts for improvement trading at what we view to be a discount to normalized valuation. The volatility in the small cap market throughout 2023 provided us with ample opportunities to acquire such companies, potentially sowing the seeds for a bountiful harvest ahead.
Tight Money Weighed on Small Caps in 2023 as a Subset of Large Companies Thrived
Following a dismal 2022, US equities staged a strong rebound in 2023 as markets began to anticipate the end of the Federal Reserve’s rate-hike cycle and a potential policy pivot. Headline returns belie what proved to be a more nuanced period, however. Though the S&P 500 Index climbed 26.9% in 2023, a large portion of this gain was driven by a small group of very large stocks whose exposures to alternative intelligence technologies captured investor attention; by year end, the “Magnificent Seven” of Alphabet, Amazon, Apple, Meta, Microsoft, Nvidia and Tesla comprised 28% of the index.2,3In contrast, the S&P 500 Equal Weight Index, which allocates identical weightings to each company in the S&P 500, returned a relatively meager 13.8% in 2023, lagging the 16.9% gain posted by the Russell 2000 Index.4
Small caps historically have done well in rising-rate environments, but their early-2023 performance—after a very strong start—was derailed by the turmoil that struck regional banks in March. Not only did the collapse of Silicon Valley Bank, First Republic Bank and Signature Bank send shares of small cap banks broadly lower in fear of systemwide contagion, it reinforced the already tighter lending standards of the banks that many small companies depend on for financing. Meanwhile, the tight-money environment also dampened mergers and acquisitions (M&A) activity by private equity vehicles, historically a source of support for small cap valuations. Despite these headwinds, the Russell 2000 ultimately delivered robust gains for the year, staging a spirited rebound in November and December as market sentiment appeared to coalesce around a “soft landing” scenario for the economy.5
Stabilizing Interest Rates May Finally Refocus Investor Attention on Fundamentals
Last year’s volatility provided opportunities to acquire fundamentally solid companies at valuations we believe were distorted by cyclical forces. There are reasons to think that these actions may be rewarded in 2024, especially if slowing economic activity and cooling inflation prompt the Fed to cut its policy rate, as bond futures markets expect.6 Easier monetary conditions may bolster investor risk appetites, provide small companies with greater operational and financial flexibility, and jumpstart M&A activity among private equity funds eager to deploy their massive stores of dry powder.
Though by no means foolproof, troughs in the Conference Board’s Leading Economic Index (LEI)—a composite index of economic and market variables that in aggregate purports to anticipate potential turning points in the business cycle—historically have augured well for the performance of small cap stocks relative to large caps, as illustrated in Exhibit 1. Recent LEI data suggest the metric may be bottoming after a long period of decline, at least partly due to indications of cooling inflation. At 2.6% and 2.9%, respectively, growth in headline and core personal consumption expenditures (PCE) price indexes ended 2023 at early-2021 levels.7 Mixed employment data has clouded the forecast, however. While a number of metrics have reflected the impacts of tighter monetary policy, nonfarm payrolls have persistently defied expectations,8 and wage growth remains at a level not seen since the early 2000s.9 These disparate data points keep “higher for longer” rates firmly in play—and serve as good reminders of why we focus on the factors we can control rather than trying to make timing calls.
Exhibit 1. Troughs in the Leading Economic Index Historically Have Presaged Small Cap Outperformance
US Leading Economic Index, January 1960 through November 2023
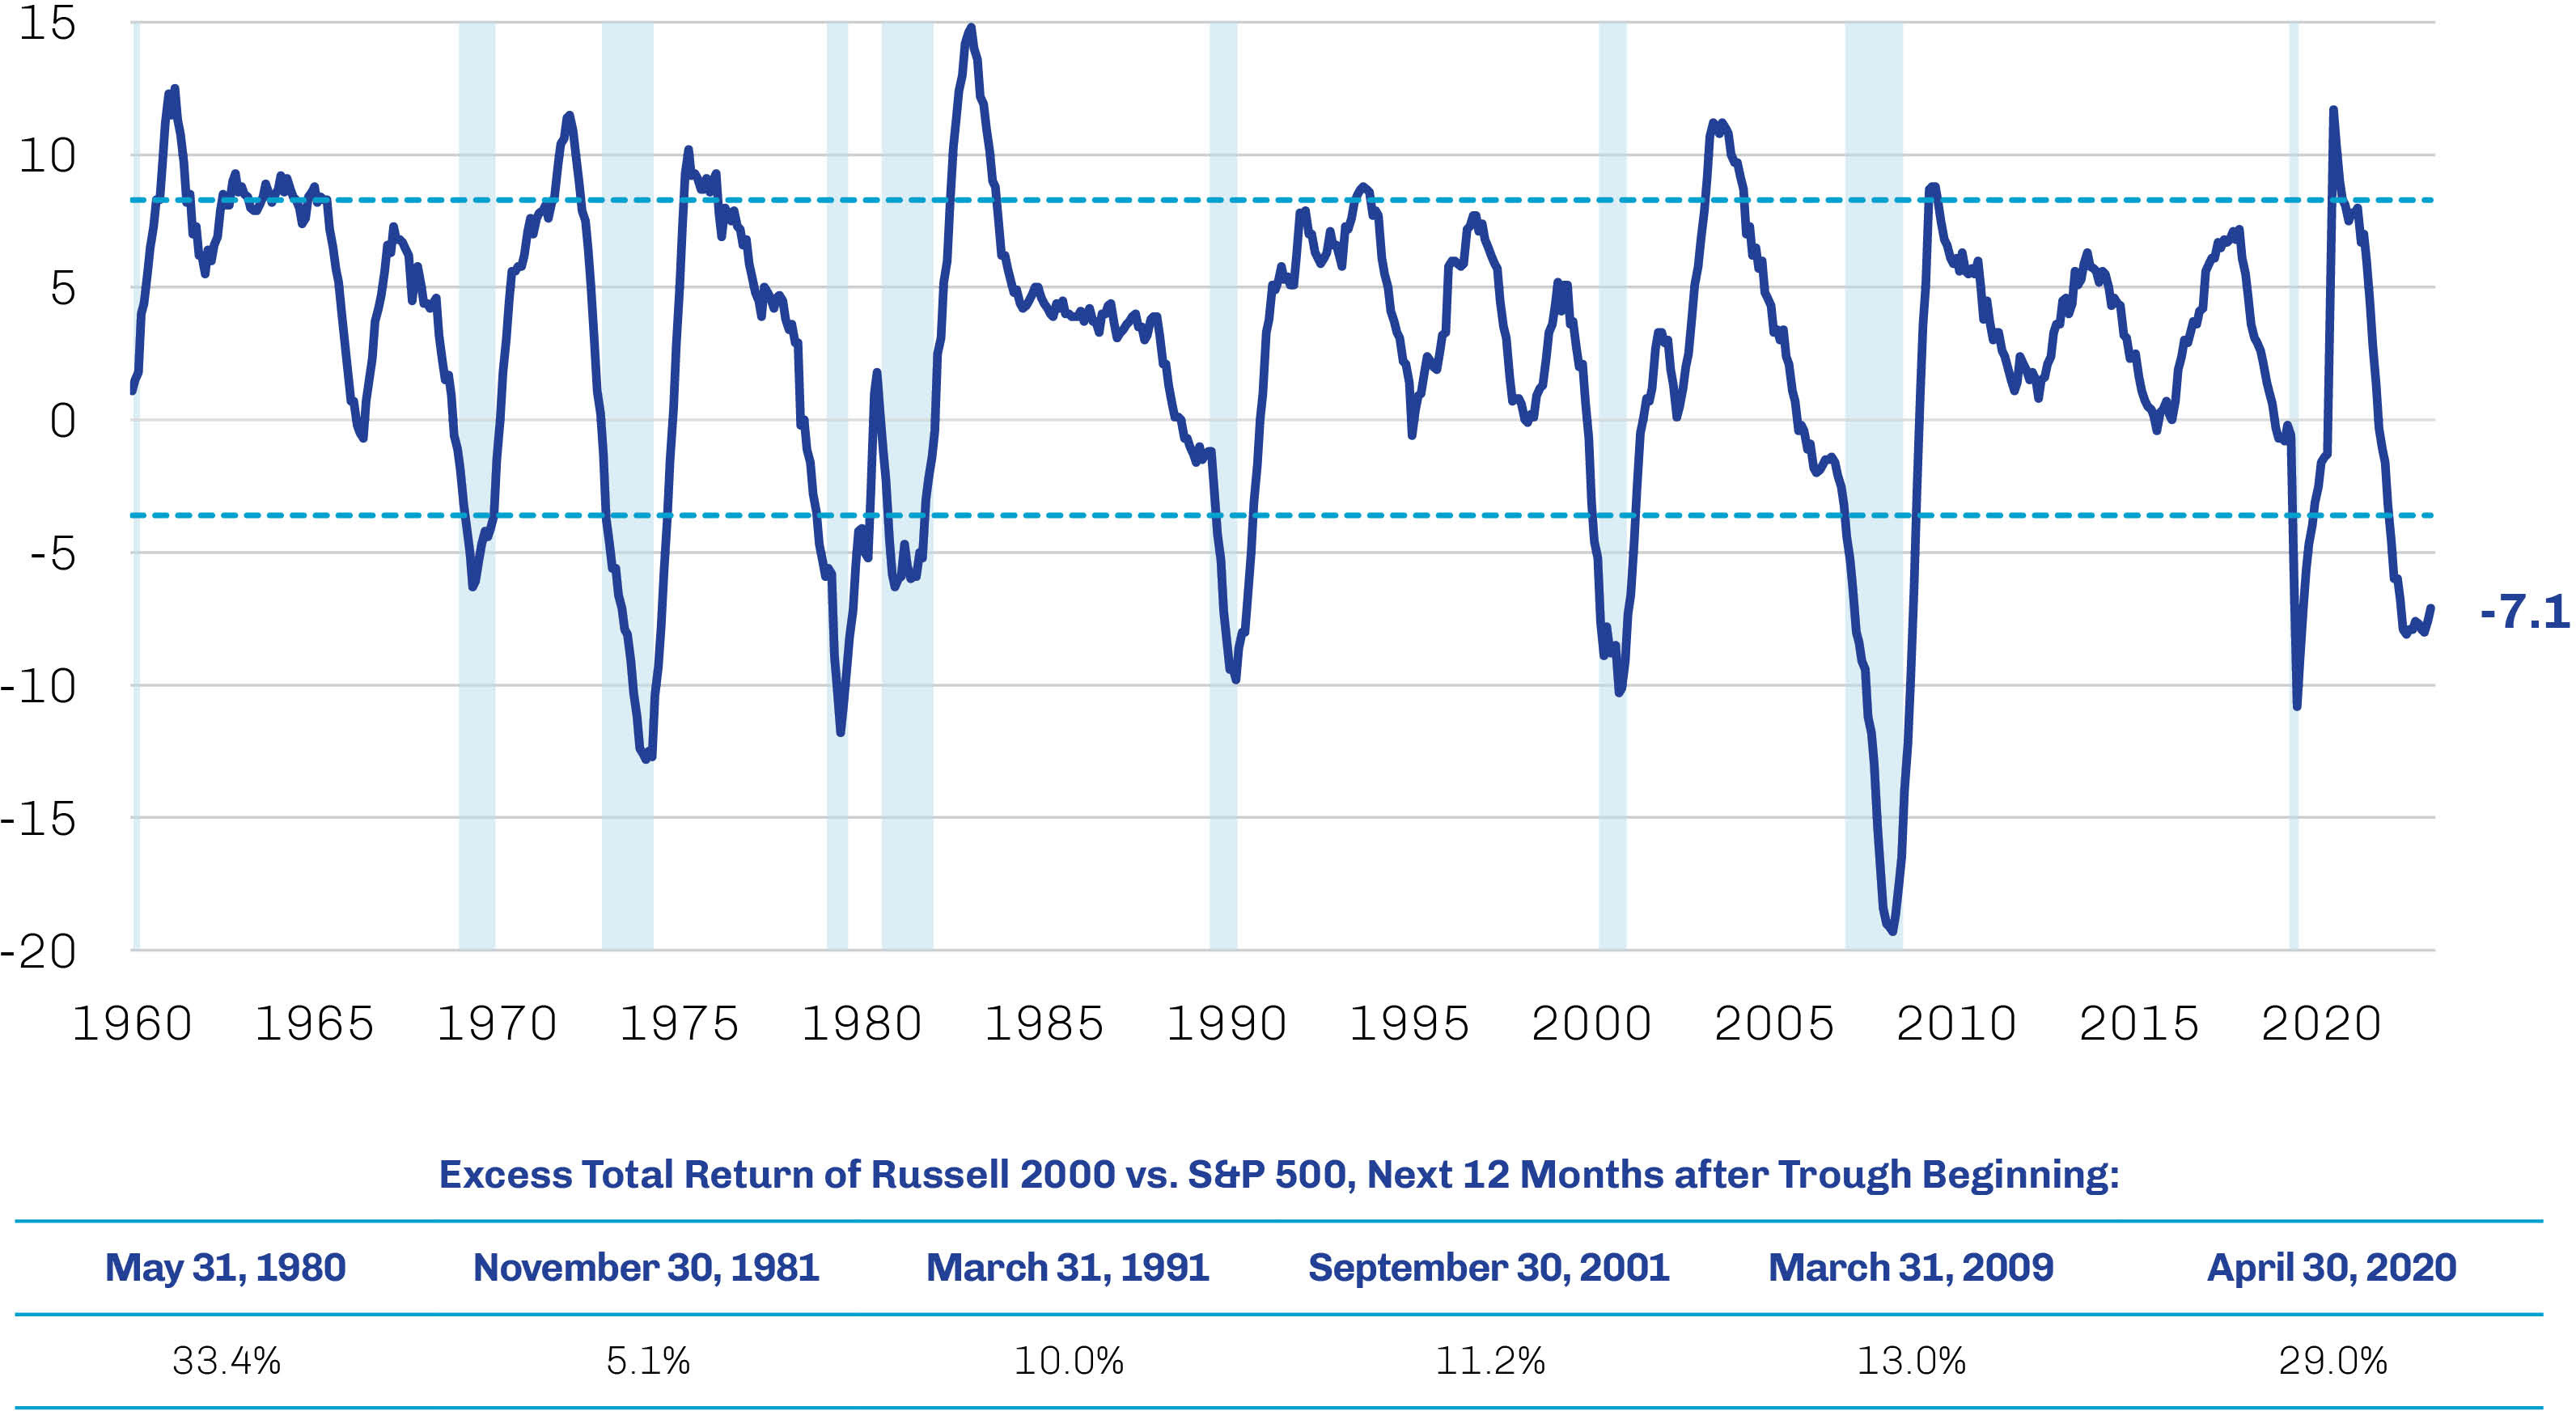
Source: The Conference Board, FactSet, Bloomberg; data as of December 31, 2023.
Seeking Prospects for Revaluation
In the final analysis, investors can control only which stocks they buy and how much they pay for them. We believe those who devote their efforts to identifying and investing in good businesses at attractive valuations may see the most success over the long run, and current small cap valuations continue to suggest an environment ripe for finding such companies despite strong gains in 2023.
As illustrated in Exhibit 2, the Russell 2000 appears very cheap on a trailing price-to-earnings basis, relative both to its historical average (a 17% discount) and to the S&P 500 (a 39% discount).11 Notably, the last time small cap valuations hit similar lows was in 2009 amid the global financial crisis, after which the Russell 2000 delivered returns of 30% for each of the next three years.12 Further, it’s worth remembering that a discount for small cap stocks is a relatively recent phenomenon. For most of the period between 2003 and 2017, small caps traded at a premium to large caps, and small cap stocks—small cap value stocks, in particular— have outperformed their large cap value and growth counterparts over full investment cycles.13 Mean reversion historically has had a powerful influence over financial markets and may serve as an additional tailwind for small stocks.
Exhibit 2. Small Caps Appear Cheap Compared to Large Caps and to Their Own History
Trailing Price-to-Earnings Multiples, January 2004 through January 2024
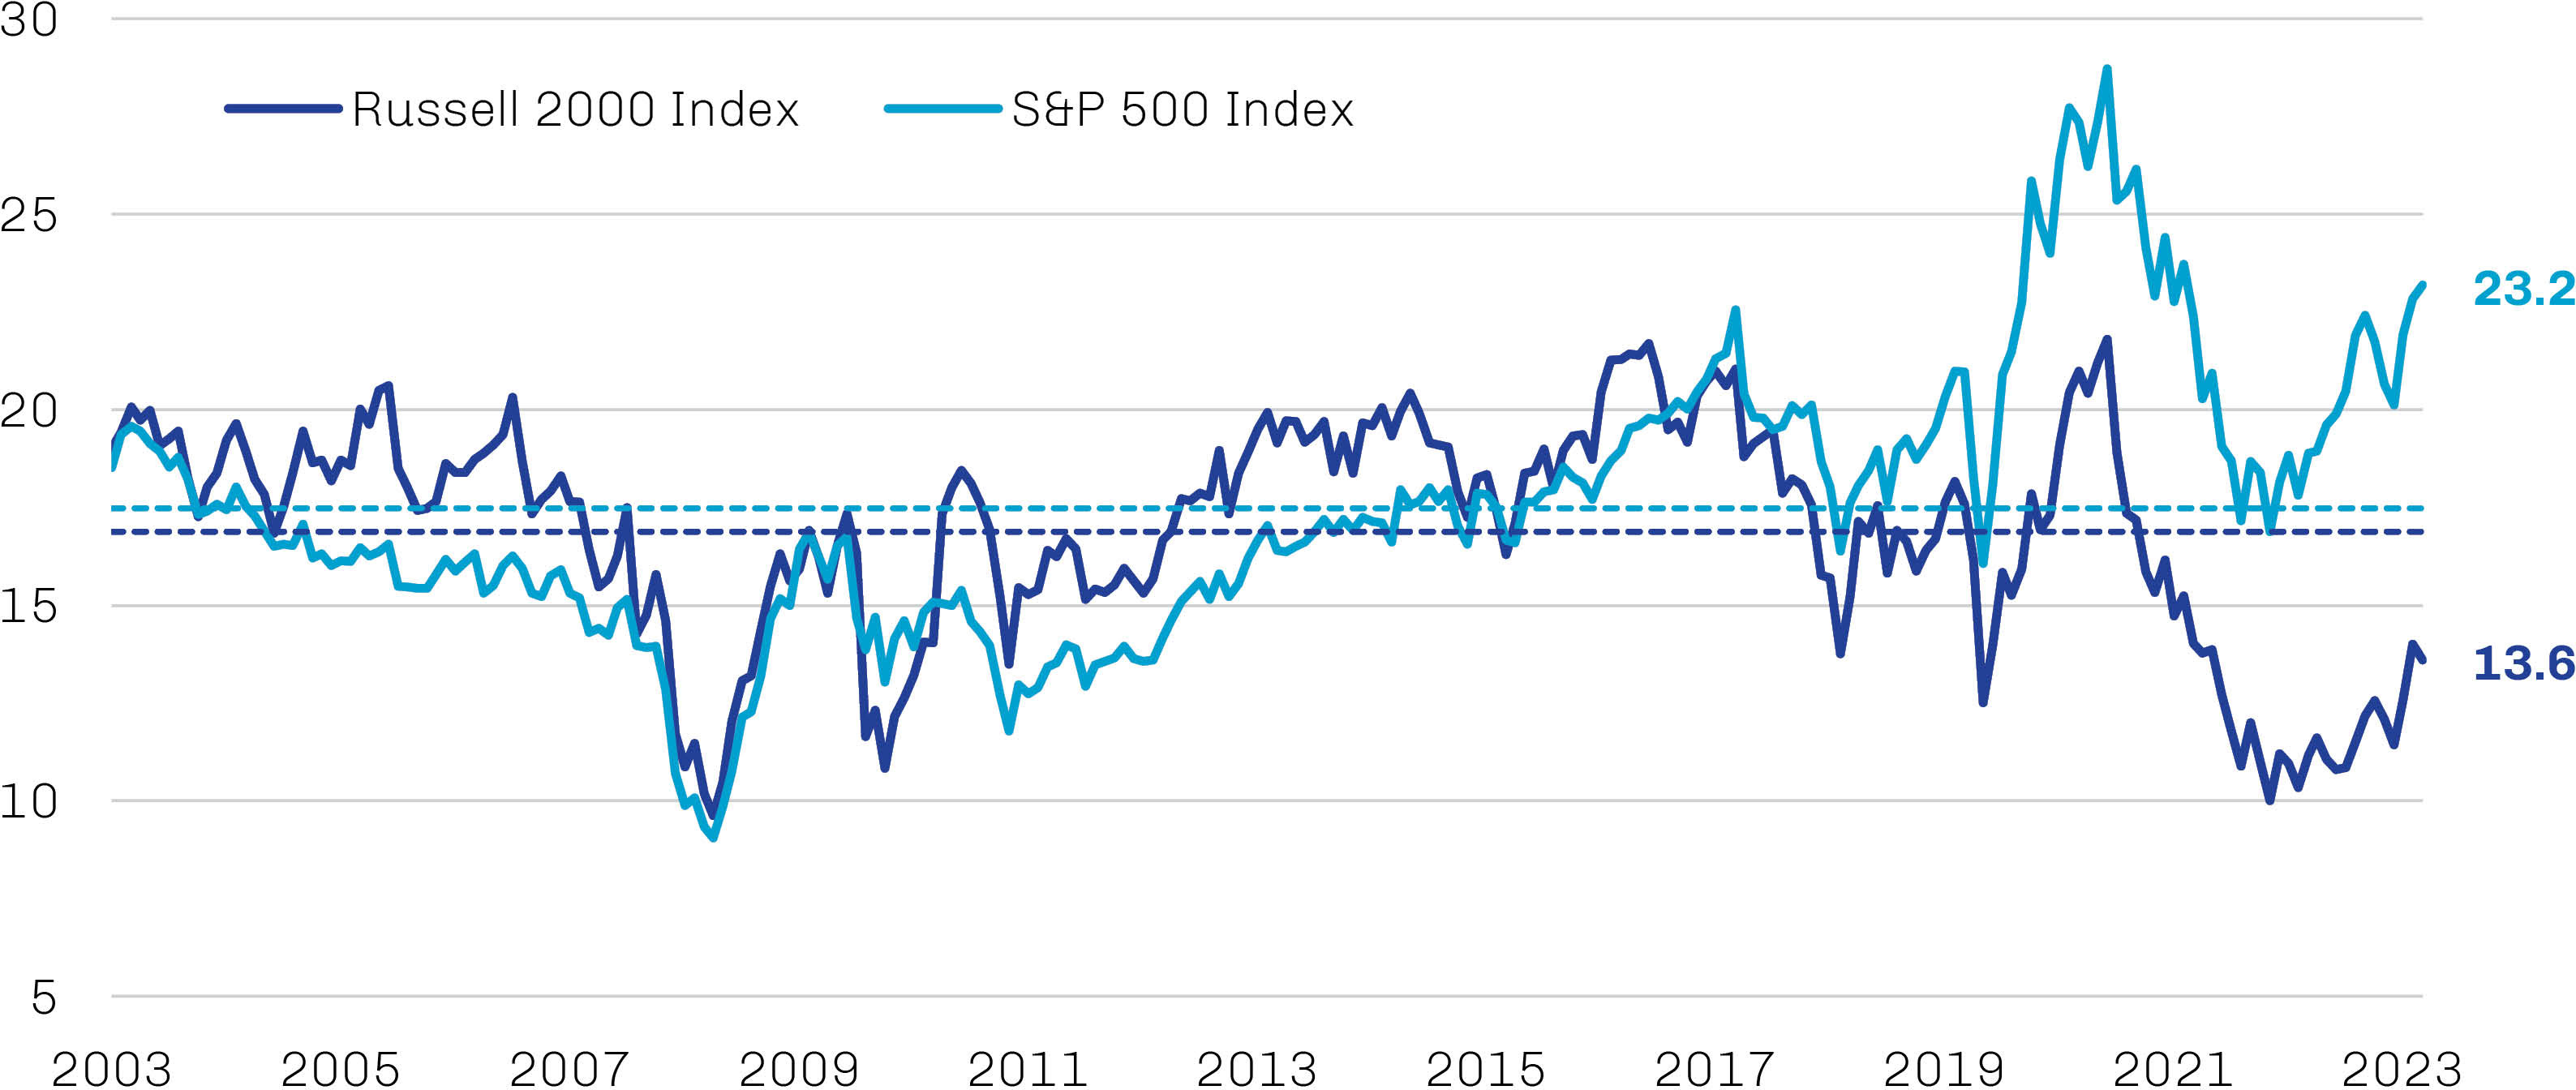
Source: FactSet; data as of January 31, 2024.
As favorable as small cap valuations may be at the index level, buying the index is not likely a path to optimal returns, in our view. As Warren Buffet, quoting Benjamin Graham, observed, a “wildly fluctuating market means that irrationally low prices will periodically be attached to solid businesses.”13 Small caps represent one such wildly fluctuating market, and its pronounced volatility and inefficiency historically have created opportunities for skilled active managers to generate alpha—more so than any other equity asset class, as shown in Exhibit 3.
Exhibit 3. Small Cap Markets Have Historically Offered Alpha-Generating Opportunities
Active Manager Success Rate versus US Indexes by Morningstar Category; Periods Ended January 31, 2024
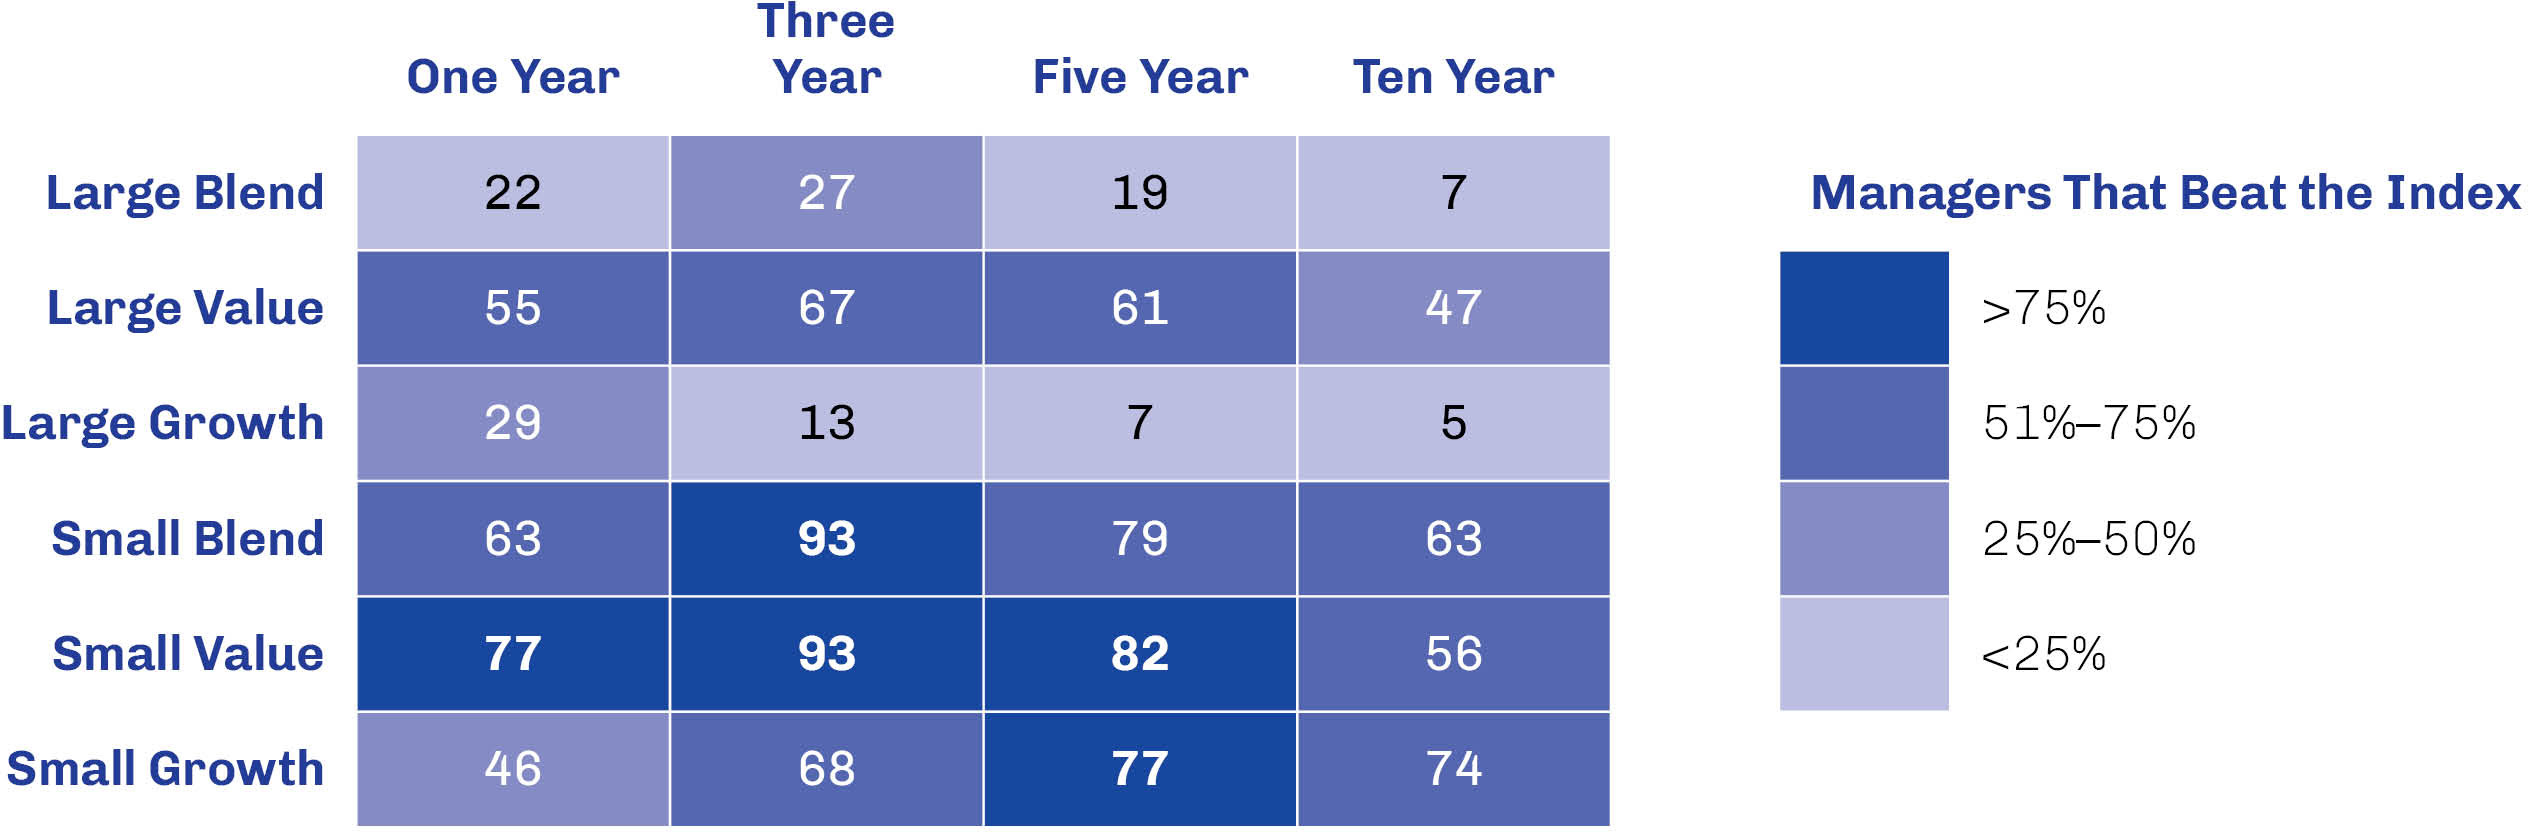
Source: Morningstar; data as of January 31, 2024.
Amid what we believed to be an abundance of attractive investment opportunities in 2023, we remained focused on targeting really good companies while controlling the one variable that we can—the price we pay. Given that 42% of the companies in the Russell 2000 were unprofitable as of September 30, 2023—versus only 7% of the S&P 500—we think sorting the wheat from the chaff is a worthwhile endeavor in the broad and diverse small cap universe.14 Regardless of the central bank’s actions in 2024, it seems likely companies that are cheap for a reason will continue to face a challenging operating environment, while many of those with solid businesses and catalysts for improvement may progress toward valuations more consistent with historical levels.