BLOGThe Bird's Eye View
Timely Perspectives, Unconventional Thinking
We’re excited to share timely market insights, thoughtful perspectives and expert commentary as part of our commitment to providing modern investment solutions to modern challenges.
BLOGThe Bird's Eye View
Timely Perspectives, Unconventional Thinking
We’re excited to share timely market insights, thoughtful perspectives and expert commentary as part of our commitment to providing modern investment solutions to modern challenges.

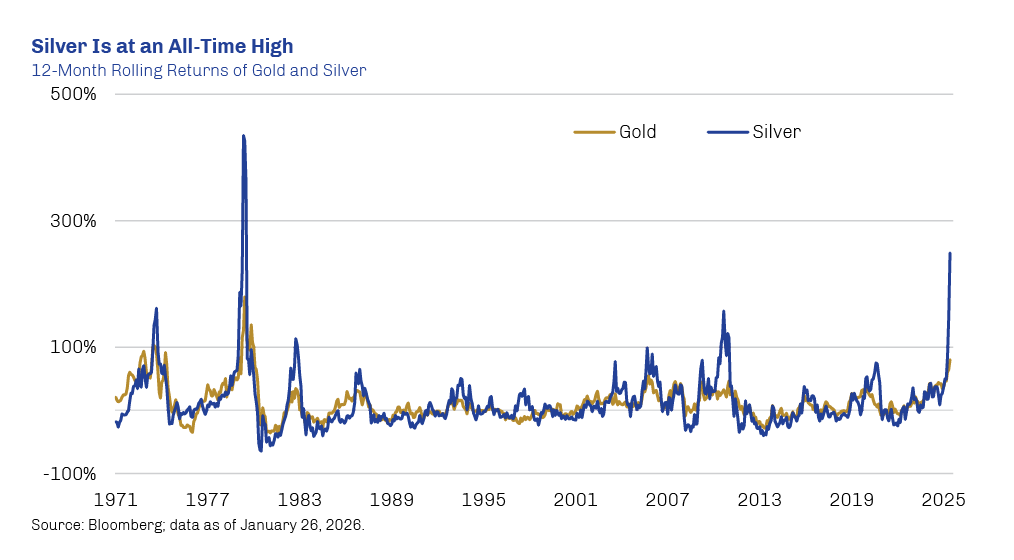
After spiking 65% in 2025, gold has continued to surge in the first few weeks of 2026, establishing a string of new real and nominal price highs.1 With sovereign debt levels still growing and already-high geopolitical tensions ratcheting up a notch, central banks and investors remain eager to pile into the yellow metal as a potential hedge against tail risks and currency debasement.
Gold hasn’t been the only beneficiary of this dynamic, as other precious metals have also broken out. Silver bullion, for example, gained 146% last year and its momentum has shown no signs of letting up in 2026.2 Silver historically has tracked the gold price in direction but with greater volatility given its industrial applications and lack of historical buying support from central banks. The outsized influence of futures trading on the price of silver has also contributed to its volatility.
Strong physical demand for silver—for use in items like solar panels, electric vehicles and consumer electronics—amid ongoing structural supply constraints combined with investment demand has supported the recent silver rally. Investment demand for silver—even if it looks promising given current fiscal and geopolitical dynamics—is very hard to forecast in the short-term as it is highly dependent on the current volatile liquidity conditions.
Can Muni Bond Fundamentals Remain Steady?

Head and Chief Investment Officer of Municipal Credit Team
The municipal bond market has rebounded from the technical pressures of the first half of 2025 caused by record-setting issuance.1 As 2026 begins, we believe that municipal fiscal conditions continue to be strong. State budgets for fiscal 2026 overall reflect a healthy environment, and general fund balances remain well above the historical average even as they continue to ease from 2023’s peak. Though state general fund revenue has fallen off the record pace of fiscal 2021 and 2022 as the impact of Covid–era relief waned, it has continued to grow, and modest revenue gains are expected in fiscal 2026. Budgets enacted to date suggest flat general fund spending in 2026, and most states plan to maintain or increase the size of their rainy-day fund—many of which are already at nominal highs—in anticipation of future needs.2
Another sign of fiscal strength can be found in improved pension funding, as the aggregate median ratio for local-government pensions climbed to 80% in fiscal 2024 from 78% in fiscal 2022. While this can be attributed in part to market performance, local governments have increased contributions and tweaked their benefit structures, demonstrating improved funding discipline and better long-term sustainability.3
Overall, muni bond ratings activity has been positive in 2025, but not by much: Positive activity (including both upgrades and favorable outlook revisions) outpaced negative activity at a rate of 1.4x year to date through November.4 Both defaults and first-time distressed debt remained very low in 2025.5
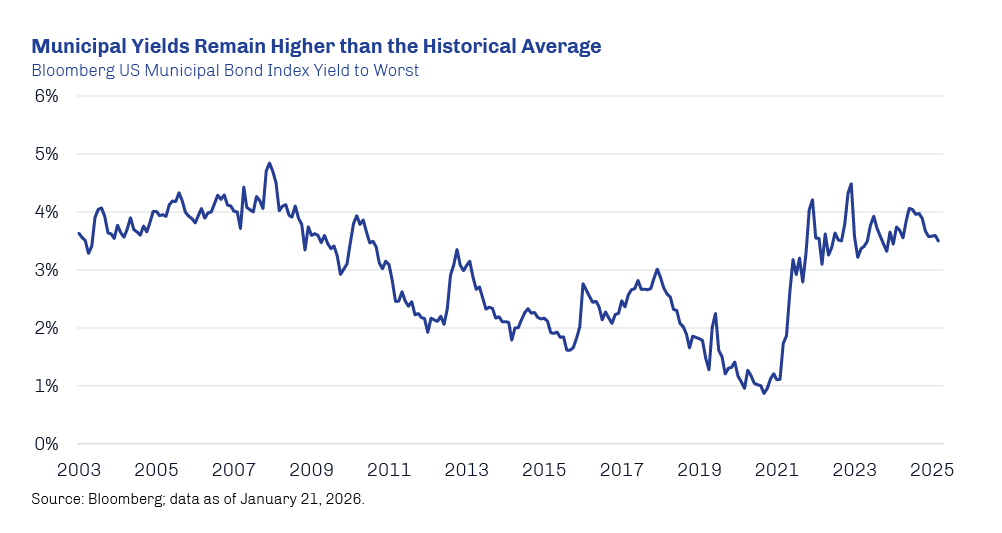
Muni yields are still attractive relative to their historical averages, in our view, and current dynamics provide particularly favorable conditions managers to uncover attractive opportunities through fundamental, research-driven credit selection.