Commentaries

Small Cap Opportunity Fund Commentary

Small Cap Opportunity Fund Commentary

Market Overview

As of July 30, 2026

Smaller stocks surged in the second quarter as easing Middle East tensions buoyed investor confidence.

With a fragile peace reached between the US and Iran, equity markets more than recovered from their first quarter challenges. Though equities in general benefitted from the shift in sentiment, smaller stocks continued to outperform larger names. The Russell 2000 Index advanced 21.5% during the quarter compared to the 15.2% gain of the S&P 500 Index, and its 22.6% first-half gain is the best start to a year since 1991.1 Growth outperformed value during the quarter across capitalizations.2

The Beat Goes On

In a theme similar to what we have seen in the large cap space, smaller- stock index performance year-to-date has been quite concentrated, with energy leading the way in the first quarter and tech rebounding in the second. In fact, the magnitude of capital expenditures by hyperscalers— companies like Amazon, Apple, Meta, Microsoft and Oracle that operate massive data centers supporting cloud computing—has been a source of support across markets. Spending on data-center software and information processing equipment relative to GDP now exceeds the dot-com peak, funded primarily out of operating cash flow and, increasingly, debt issuance, and is forecast to continue. Even if new spending were to moderate, the long-term nature of projects like data centers suggests hyperscaler capex may be a source of support for smaller companies supporting the artificial intelligence (AI) infrastructure build.

From a macro perspective, the big news in the second quarter was the pronounced shift higher in US interest rate expectations even as those for other major economies generally moderated. One reason for this has been the appointment of Kevin Warsh as chair of the Federal Open Market Committee, replacing Jerome Powell. While Warsh’s nomination for the role in March initially had some observers questioning his ability to lead the central bank independent of President Trump’s rate-cutting influence, sentiment regarding his credibility has since shifted markedly. While it remains to be seen if Warsh’s credibility is merely enjoying a honeymoon period to begin his term, his consistently hawkish tone has helped push two-year yields and the dollar higher.

Smaller companies tend to be more reliant on short-term, floating-rate debt than large cap names, so any shift toward tighter policy could have a material impact on the companies in this space. While we view rate hikes as possible based on Warsh’s rhetoric, the deliberate lack of formal Fed guidance under the new regime makes policy trajectory difficult to assess. Further, as credible as Warsh may be, he doesn’t have the same degree of policy flexibility that many of his predecessors had given today’s fiscal situation. The ability to increase interest rates meaningfully in the face of inflationary pressures is likely constrained by the government’s need to continually roll over its very large primary deficit at prevailing higher interest rates.

A Nice Problem to Have

The sharp run-up in certain areas if the portfolio has forced us to exercise strict valuation discipline, which is a painful but necessary part of managing smaller stocks. However, we are excited about the undervalued names we have been able to acquire with our profits, whether it’s in healthcare or consumer staples or in more idiosyncratic opportunities.

Smaller stocks in general should find support going forward in resurgent fundamentals. For example, published forecasts reflect 85% earnings growth for the Russell 2000 in 2026 and 44% in 2027 compared to 27% and 18%, respectively, for the S&P 500. Revenue growth, too, is forecast to improve over the next several quarters.3

In addition, the reopening of the initial public offering (IPO) market in recent quarters has increased the number of stocks from which to choose. While mega IPOs like SpaceX get all the headlines, issuers tend to be on the smaller side. There were 65 traditional IPOs in the US market during the first half of 2026, raising about $114 billion, or more than seven times the amount raised in the same period last year; an additional 118 companies, worth $21 billion, came to market via the special purpose acquisition company (SPAC) channel.4 And a vigorous pipeline remains. Aside from the backlog of mature, high-profile companies, many private equity firms have held smaller portfolio companies longer than optimal, creating pressure to exit and return capital to investors. Additionally, companies that postponed IPOs due to government shutdowns could reemerge, facilitated by a benign regulatory environment focused on increased capital access and reduced compliance burdens.5

Portfolio Review


Small Cap Opportunity Fund A Shares (without sales charge*) posted a return of 25.53% in second quarter 2026. Information technology and industrials were the leading contributors among equity sectors; energy was the only detractor and utilities were flat. The Fund outperformed the Russell 2000 Value Index in the period.

The capital investment cycle surrounding the build out of AI-related infrastructure and data centers has supported sales and earnings growth for many of the smaller and mid-sized companies that supply the “picks and shovels” needed to build out AI capacity. This dynamic has spanned from suppliers to infrastructure and data-center construction to companies that enable system-level performance for compute, memory and network connectivity. It also has prompted a strong capital spending cycle for the semiconductor industry, which has benefited the semiconductors and semiconductor capital equipment companies that supply parts and services to major chip manufacturers.

Leading contributors in the First Eagle Small Cap Opportunity Fund this quarter included Vishay Intertechnology, Inc., Silicon Motion Technology Corporation Sponsored ADR, Ultra Clean Holdings, Inc., Cohu, Inc. and TTM Technologies, Inc.

Vishay Intertechnology manufactures discrete semiconductors and passive electronic components that manage power in electronic systems. The company reported better-than-expected results for its most recent quarter, driven by higher volumes across a variety of end markets, including AI-related applications, industrial and aerospace, and defense.

Silicon Motion Technology supplies NAND flash controllers for solidstate storage devices. The company has experienced strong demand for embedded storage controllers, AI-related applications and automotive and industrial applications.

Ultra Clean develops and supplies components, parts and subsystems for ultra-high-purity cleaning and analytical services for the semiconductor industry. The company’s earnings and strong stock performance were driven by AI spending and investments in wafer fab equipment.

Cohu provides test, automation, inspection and metrology products, software analytics solutions and services to the semiconductor industry. As chip density increases to support more processing power for AI applications, the company has seen demand increase for testing its services and solutions.

TTM Technologies manufactures electronic components, including advanced printed circuit boards, radio frequency components and microwave/microelectronic assemblies. The company has seen strong demand from data centers as well as the defense industry.

The leading detractors in the quarter were Oil States International, Inc., LSB Industries, Inc., Artivion, Inc., Murphy Oil Corporation and Century Aluminum Company.

Oil States provides equipment and services to the oil and natural gas industry, focusing on shale basins in the US and deepwater/offshore developments internationally. Oil States’ relatively short business cycle left it vulnerable to disruptions in the Middle East during the quarter. The company retains a strong order backlog, and we like its focus on higher margin offshore opportunities. Oil States’ current valuation is comparable to commodity oil field service providers, belying its specialty characteristics as an industrial manufacturer.

LSB produces and markets nitrogen-based chemicals for the agricultural, industrial and mining sectors. Geopolitical tensions in the Middle East disrupted supplies of ammonia and urea during the quarter. To address this challenge, LSB is escalating domestic debottlenecking projects and evaluating strategic acquisitions in the US to reduce dependance on volatile import markets. Meanwhile, agricultural demand for nitrate fertilizers and industrial demand for ammonium nitrate have remained robust despite elevated prices.

Artivion is a global medical device company with cardiac and vascular solutions for aortic diseases, including stent grafts, surgical sealants, mechanical heart valves and implantable human tissue. Artivion’s shares weakened as demand paused for one of the company’s new open-heart products as it approached formal approval. We regard this lull as temporary and expect sales of this product—along with their new product for minimally invasive surgery—to ramp well with accretive margins.

Murphy Oil is an independent energy company focused on the exploration, development and production of crude oil, natural gas and natural gas liquids. It primarily operates upstream assets in the US Gulf of Mexico, the Eagle Ford shale in Texas and various regions of Canada. Murphy was under pressure during the quarter as reduced hostilities in the Middle East relieved upward pricing pressure on several commodities, including oil and gas. Murphy’s discovery in the Cuu Long Basin of Vietnam in January 2026 was the largest oil find in Southeast Asia in two decades and could be transformational for the company and underpins our continued holding of the position.

Century Aluminum, a global metals and mining company with a significant presence in the US, produces bauxite, alumina and aluminum. Shares traded down along with aluminum prices following the first announced cease fire with Iran. We continue to see long-term value in the shares. Aluminum is an important strategic asset, and Century’s operations in this space would be difficult to replicate. Meanwhile, cash flows remain strong.

* Performance for Class A shares without the effect of sales charges and assumes all distributions have been reinvested, and if a sales charge was included values would be lower.

1. Source: Furey Research Partners; data as of July 6, 2026.
2. Source: FactSet; data as of July 30, 2026.
3. Source: LSEG I/B/E/S; data as of July 9, 2026.
4. Source: PwC; data as of July 10, 2026.
5. Source: Cleary Market Watch; data as of February 5, 2026.
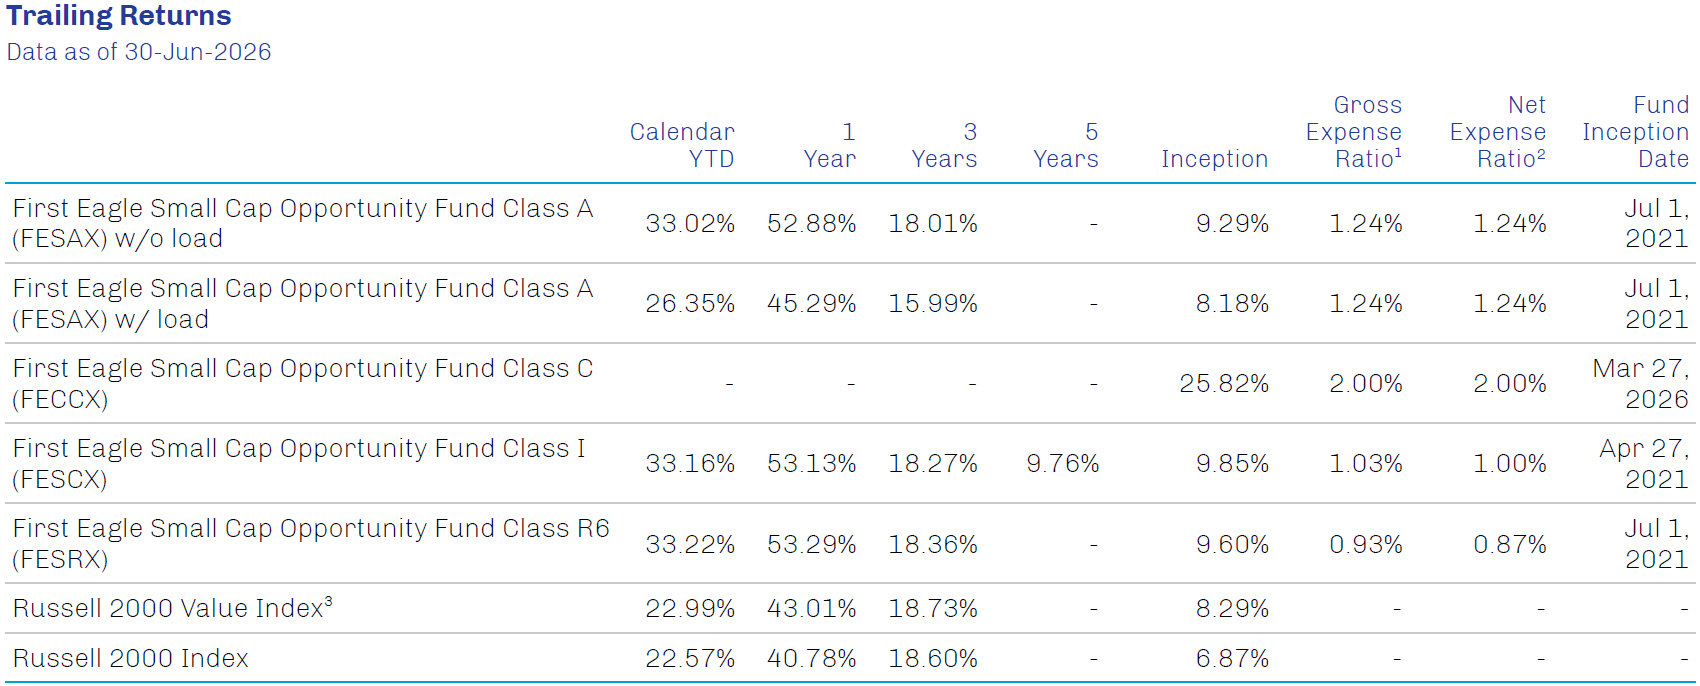


The performance data quoted herein represents past performance and does not guarantee future results. Market volatility can dramatically impact the fund’s short term performance. Current performance may be lower or higher than figures shown. The investment return and principal value will fluctuate so that an investor’s shares, when redeemed may be worth more or less than their original cost. Past performance data through the most recent month end is available at www.firsteagle.com or by calling 800-334-2143. “With load” performance for Class A Shares gives effect to the deduction of the maximum sales charge of 5.00%. Class I Shares require $1mm minimum investment, and are offered without sales charge. Class R6 is offered without sales charge.

1. Gross expense ratio is the total annual fund operating expenses before fee waivers.

2. The net expense ratio is the gross expense ratio after waivers and/or reimbursements.

3. Primary index.
First Eagle Investment Management, LLC (the “Adviser”) has contractually agreed to waive and/or reimburse certain fees and expenses of Classes A, C, I and R6 so that the total annual operating expenses (excluding interest charges on any borrowings, taxes, brokerage commissions and other expenses incurred in placing orders for the purchase and sale of securities and other investment instruments, acquired fund fees and expenses, dividend and other expenses relating to short sales, and extraordinary expenses, if any) (“annual operating expenses”) of each class are limited to 1.25%, 2.00%, 1.00% and 0.87% of average net assets, respectively. The undertakings for Classes A, C and I last until 28-Feb-2027, and the undertaking for Class R6 lasts until 28-Feb-2028. These undertakings may not be terminated during their respective terms without the consent of the Board of Trustees. The Fund has agreed that each of Classes A, C, I and R6 will repay the Adviser for fees and expenses waived or reimbursed for the class provided that repayment does not cause annual operating expenses (after the repayment is taken into account) to exceed the lesser of: (1) 1.25%, 2.00%, 1.00% and 0.87% of the class’ average net assets, respectively; or (2) if applicable, the then-current expense limitations. Any such repayment must be made within three years after the year in which the Adviser incurred the expense.
Investments are not FDIC insured or bank guaranteed and may lose value.

The annual expense ratio is based on expenses incurred by the Fund, as stated in the most recent prospectus.


Risks

All investments involve the risk of loss of principal.

Diversification does not guarantee investment returns and does not eliminate the risk of loss.

The value and liquidity of portfolio holdings may fluctuate in response to events specific to the companies or markets, as well as economic, political or social events in the United States or abroad. During periods of market volatility, the value of individual securities and other investments at times may decline significantly and rapidly. The securities of small and micro-size companies can be more volatile in price than those of larger companies and may be more difficult or expensive to trade. There are risks associated with investing in foreign investments (including depositary receipts). Foreign investments, which can be denominated in foreign currencies, are susceptible to less politically, economically and socially stable environments, fluctuations in the value of foreign currency and exchange rates, and adverse changes to government regulations. A principal risk of investing in value stocks is that the price of the security may not approach its anticipated value or may decline in value. “Value” investments, as a category, or entire industries or sectors associated with such investments, may lose favor with investors as compared to those that are more “growth” oriented. Funds whose investments are concentrated in a specific industry or sector may be subject to a higher degree of risk than funds whose investments are diversified and may not be suitable for all investors.


Definitions

Federal funds rate is the interest rate at which depository institutions (banks and credit unions) lend reserve balances to other depository institutions overnight on an uncollateralized basis. Gross domestic product (GDP) measures the total value of all economic output in goods and services for an economy. 

Russell 2000® Index (Gross/Total) measures the performance of the small-cap segment of the US equity universe. It includes approximately 2,000 of the smallest securities based on a combination of their market cap and current index membership. A total-return index tracks price changes and reinvestment of distribution income. S&P 500 Index (Gross/Total) measures the performance of 500 of the top companies in the leading industries of the US economy and is widely recognized as a proxy for the US market as a whole. A total-return index tracks price changes and reinvestment of distribution income.

Indexes are unmanaged and do not incur management fees or other operating expenses. One cannot invest directly in an index.

These holdings represent the top five contributors and detractors to performance for the First Eagle Small Cap Opportunity Fund as of 06/30/2026: Vishay Intertechnology, Inc. 1.26%; Silicon Motion Technology Corporation Sponsored ADR 1.18%; Ultra Clean Holdings, Inc. 1.39%; Cohu, Inc. 1.17%; TTM Technologies, Inc. 0.81%; Oil States International, Inc. 0.46%; LSB Industries, Inc. 0.44%; Artivion, Inc. 0.22%; Murphy Oil Corporation 0.46%; Century Aluminum Company 0.45%.


Additional Disclosures

The commentary represents the opinion of the Small Cap team as of the date noted. The opinions expressed are not necessarily those of the firm. These materials are provided for informational purposes only. These opinions are not intended to be a forecast of future events, a guarantee of future results or investment advice. Any statistics contained herein have been obtained from sources believed to be reliable, but the accuracy of this information cannot be guaranteed. The views expressed herein may change at any time subsequent to the date of issue hereof. The information provided is not to be construed as a recommendation or an offer to buy, hold or sell or the solicitation of an offer to buy or sell any fund or security.

The Fund’s portfolio is actively managed and holdings can change at any time. Current and future portfolio holdings are subject to risk.

The Fund may invest in gold and precious metals through investment in a wholly-owned subsidiary of the Fund organized under the laws of the Cayman Islands (the “Subsidiary”). Gold Bullion and commodities include the Fund’s investment in the Subsidiary.

The opinions expressed are not necessarily those of the firm. These materials are provided for informational purposes only. These opinions are not intended to be a forecast of future events, a guarantee of future results or investment advice. Any statistics contained herein have been obtained from sources believed to be reliable, but the accuracy of this information cannot be guaranteed. The views expressed herein may change at any time subsequent to the date of issue hereof.

Third-party marks are the property of their respective owners.

FEF Distributors, LLC (“FEFD”) (SIPC), a limited purpose broker-dealer, distributes certain First Eagle products. FEFD does not provide services to any investor but rather provides services to its First Eagle affiliates. As such, when FEFD presents a fund, strategy or other product to a prospective investor, FEFD and its representatives do not determine whether an investment in the fund, strategy or other product is in the best interests of, or is otherwise beneficial or suitable for, the investor. No statement by FEFD should be construed as a recommendation. Investors should exercise their own judgment and/or consult with a financial professional to determine whether it is advisable for the investor to invest in any First Eagle fund, strategy or product.

Investors should consider investment objectives, risks, charges and expenses carefully before investing. The prospectus and summary prospectus contain this and other information about our funds and may be obtained by visiting our website at www.firsteagle.com or calling us at 800-334-2143. The prospectus or summary prospectus should be read carefully before investing.

First Eagle Funds are offered by FEF Distributors, LLC, a subsidiary of First Eagle Investment Management, LLC, which provides advisory services.

©2026 First Eagle Investment Management, LLC. All rights reserved.