Macro & Market Views
When We Two Parted
When We Two Parted
Reflections 2024-2025
While the synergistic economic bonds that have benefitted the US and China since the latter’s arrival on the international stage decades ago have grown increasingly strained, the US seems to be taking the decoupling in stride. Notably, China’s ongoing economic malaise has provided a much-needed disinflationary impulse to its trading partners and helped support risk appetites—for a small handful of growth assets, in particular. Matt McLennan and Kimball Brooker, co-heads of the Global Value team, discuss how changes in this dynamic could usher in a more nuanced investment landscape in which accessing differentiated sources of risk and return again take precedence.
Was “Chimerica” an Illusion All Along?
As in 2023, diversification failed to matter in 2024. For two years now, those seeking outsized equity gains likely would have been best served by focusing their investment on the most concentrated, highest-growth segment of the world’s largest stock market; that is, tech-oriented US stocks. As proxied by the “Magnificent Seven,” this cohort advanced 67% in 2024 to help fuel a 25% gain in the S&P 500 Index. The S&P 500’s gain excluding these seven stocks, which accounted for more than one-third of the index’s total market capitalization at year-end, amounted to a far more pedestrian 16%. The MSCI World Index’s 19% return was similarly bolstered by the outperformance of these megacap names.1,2
But when we decompose the factors driving the one-dimensional equity market performance of recent years, it’s not difficult to arrive at a mindset in which diversification regains its reputation as a potential driver of attractive long-term risk-adjusted returns and an essential element of a well-balanced investment portfolio.
Most notable to us has been the pronounced post-pandemic decoupling of the US and China, whose symbiotic relationship represented a primary driver of global macroeconomic activity and financial markets performance for much of the past several decades. In fact, economic historians Niall Ferguson and Moritz Schularick in 2007 coined the term “Chimerica” to describe the interconnectivity of the world’s most rapidly growing emerging market (at the time) and its dominant economic power (still). The US was happy to buy the competitively priced products mass-produced in China, China was happy to lend the resulting trade surplus back to the US through the purchase of Treasuries, and the world’s benchmark interest rate was kept in check.3 But like so many celebrity portmanteaus, Chimerica may not have been built to last.
The decoupling has been most evident in the years since the Covid-19 outbreak. Risk perception in the US has been low, supporting high equity market multiples—for growthier stocks, in particular—and tight credit spreads, as the US has benefitted from a Goldilocks economic scenario that unfolded against most expectations. Consumer and producer prices—though still slightly above target—seemingly have been reined in without torpedoing economic growth, which has helped bolster corporate earnings and raise hopes that a soft landing may be achieved.
In contrast, risk perception in China has been high—and for good reason. While China managed to avoid the early- 2020s inflation spike that bedeviled the majority of the world, its economy has faced its own set of complications, some self-inflicted. China’s aggressive zero-Covid policy—begun in early 2020 and maintained until the end of 2022, long after most nations had significantly reduced or eliminated pandemic-related restrictions—resulted in an uneven recovery that stymied private investment and household spending. An ideologically driven crackdown on the rapidly expanding domestic tech industry, launched in late 2020, hamstrung what had been among the most dynamic sectors of China’s economy and in the process wiped out trillions of dollars in market capitalization and cost countless jobs.4 The debt-fueled bubble in China’s property market—which once accounted for about 25% of the country’s gross domestic product (GDP)—burst with the default of developer Evergrande in 2021, and it continues its structural and cyclical reset to a lower base.5
As a result of these and other factors, China’s animal spirits have all but been put out to pasture; the MSCI China Index finished 2024 down more than 50% from its early-2021 peak, while yields on 10-year government bonds fell to all-time lows.6 Certain other countries in China’s orbit have been similarly afflicted.
Good News for People Who Love Bad News
In the past, signs of stress in the Chinese economy were typically viewed as bad news for global activity broadly, and risk assets would respond accordingly. This time around, however, the effects of China’s malaise have been more nuanced. China’s property market collapse, for example, is at least partly responsible for cyclically moderating inflation pressures in the US and many other countries. As shown in Exhibit 1, fixed-asset investment in China has shifted away from real estate and toward manufacturing, and the resulting excess capacity has weighed on export prices and provided China’s trading partners with a strong disinflationary impulse. Meanwhile, waning confidence among Chinese businesses and households has depressed imports and caused a range of economically sensitive commodities—everything from oil to copper to wheat—to derate versus gold, which has been another exogenous source of downward pressure on global inflation.
Exhibit 1. China’s Reemphasis on Manufacturing Has Served as a Disinflationary Impulse Globally
Year-over-Year Percent Change in China Fixed-Asset Investment, Three-Month Moving Average; January 2012 through September 2024

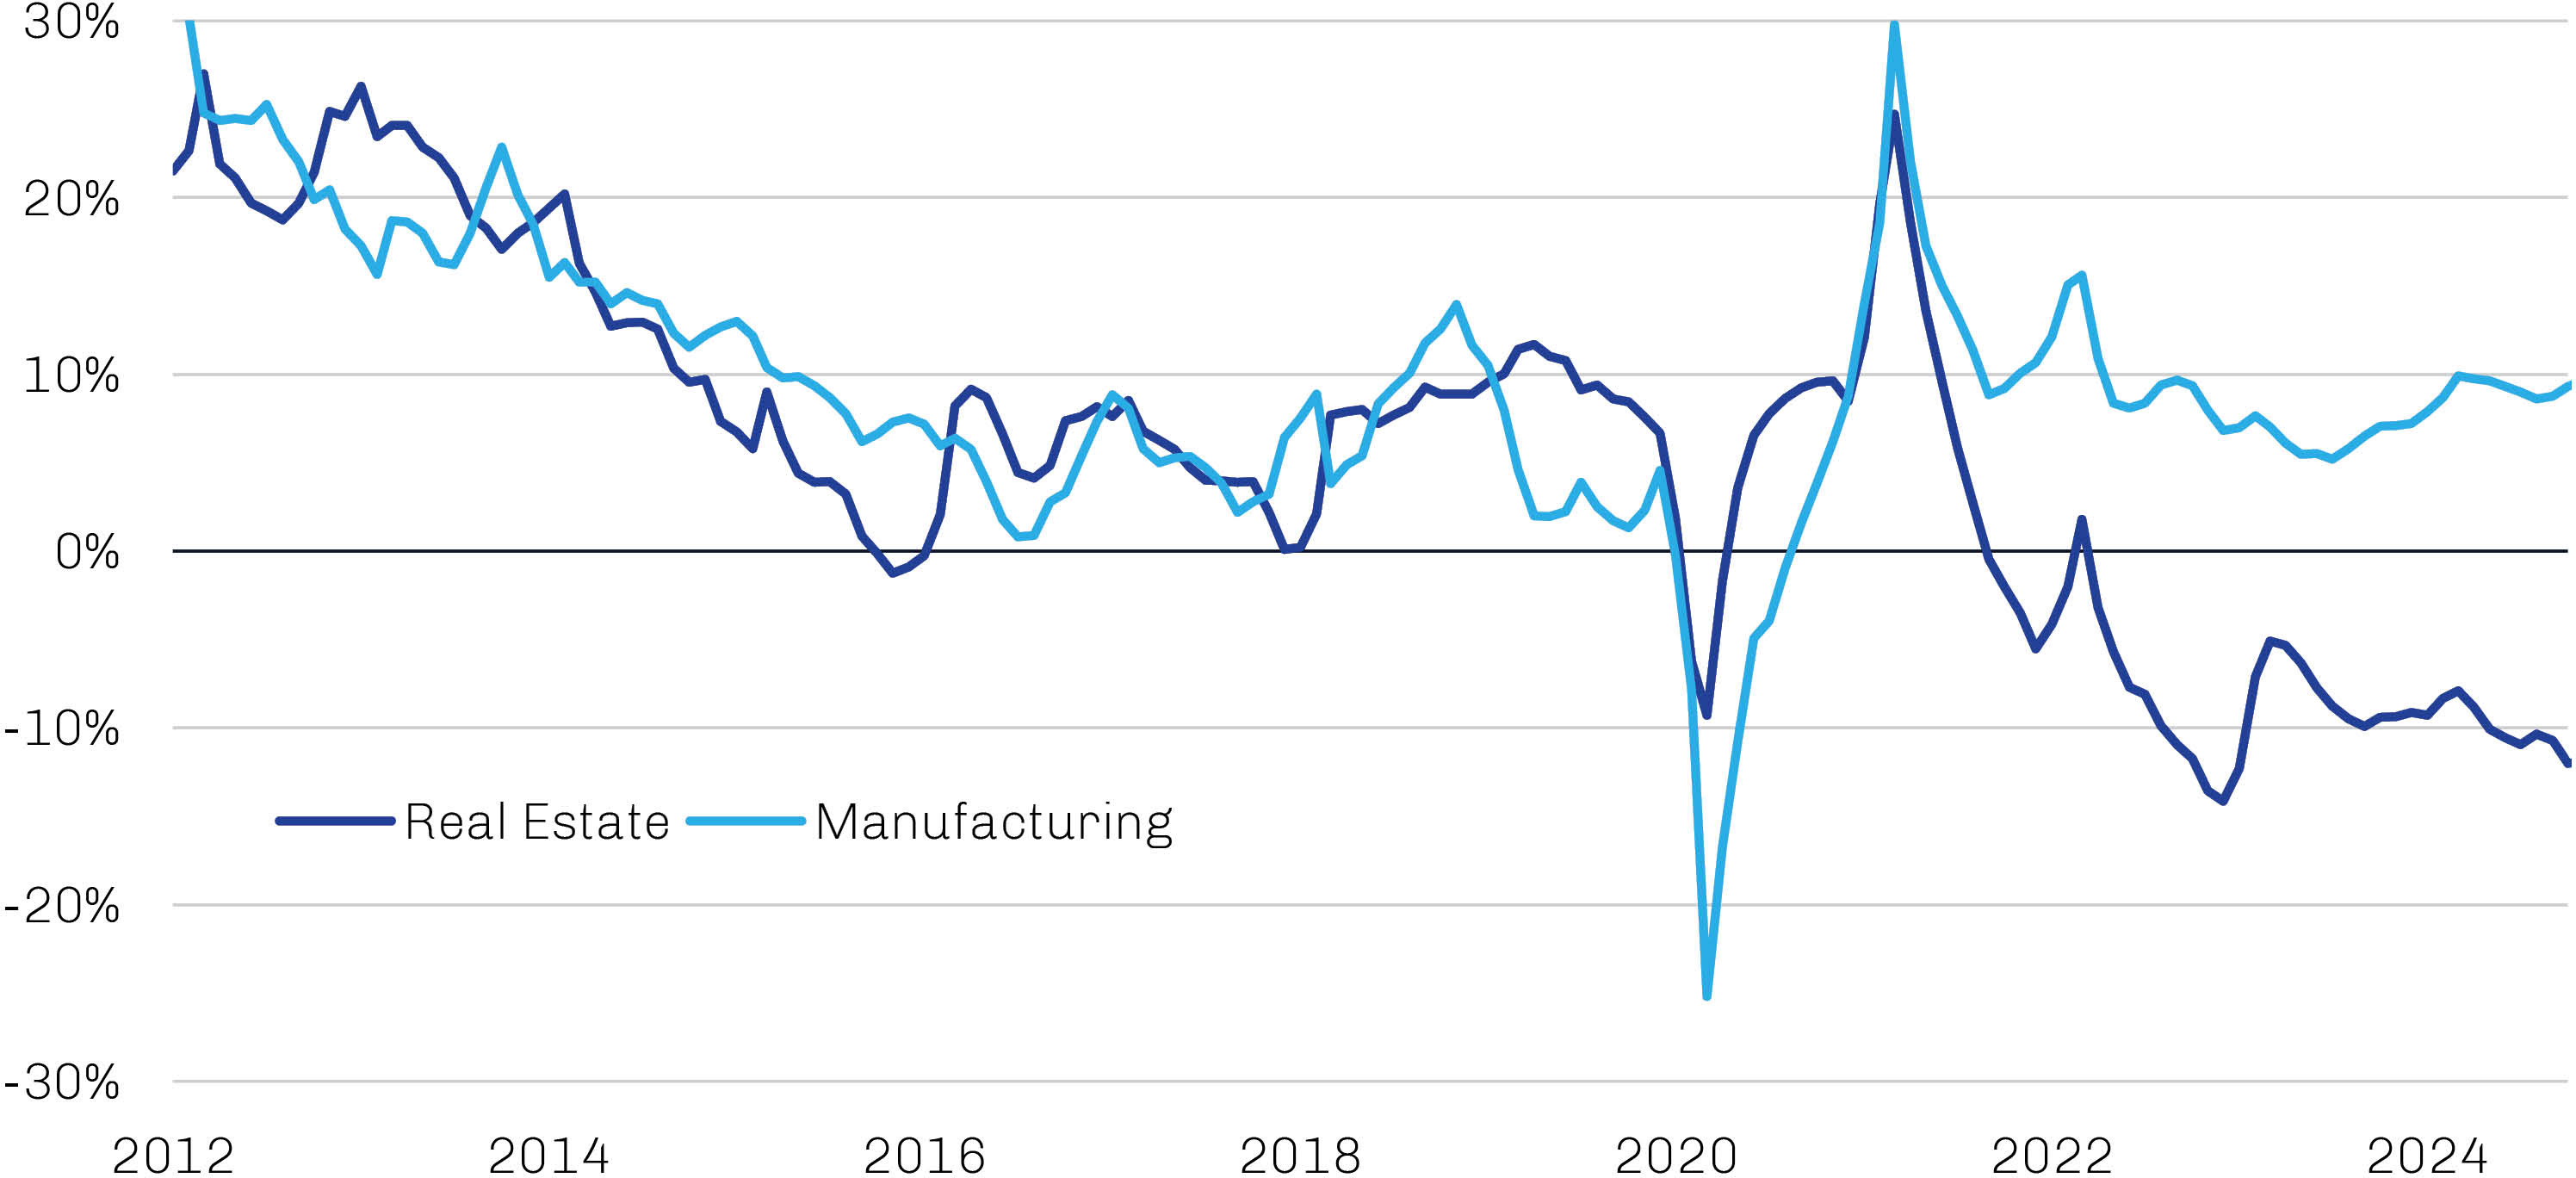
Source: UBS, First Eagle Investments; data as of September 30, 2024.
More recently, however, there are signs that the tides may be changing. With unrelentingly downbeat economic data appearing to disabuse them of any notion that their growth targets remained obtainable without intervention, China’s policymakers late in the year announced a series of stimulus measures to combat deflationary pressures, stabilize housing and rebuild market optimism. In September, the People’s Bank of China (PBOC) cut the reserve requirement ratio for banks and its benchmark short-term reverse repo rate, while instructing commercial banks to trim rates on outstanding mortgages and introducing new liquidity mechanisms to support equity markets.7 Though authorities hinted that significant fiscal support was also on tap, the initial package announced by finance officials soon after the November US elections was underwhelming in size and scope— $1.4 trillion in local government bond issuance to refinance maturing and higher-yielding local government debt rather than injected directly into the economy. However, it stands to reason that Beijing may look to keep some of its powder dry until it has better visibility on potential tariffs from the incoming Trump administration.8
The US may find itself vulnerable to a reversal of China’s fortunes, in our view, as its battle against inflation to date has reached only a fragile peace. Our concerns are underpinned by the behavior of the US labor market throughout the Federal Reserve’s tightening cycle. As shown in Exhibit 2, the labor market—unusually—softened during this period even as payrolls continued to grow, suggesting that the increase in the unemployment rate from its cyclical low of 3.4% to 4.1% by year-end 2024 was driven by increased participation rates. One theory for this phenomenon is that the massive increase in public debt outstanding post-Covid led to a nominal rebasing of the US economy that bolstered corporate profits in the face of contracting margins and supported a moderation in payroll growth rather than an outright decline. With financial conditions having since loosened, both corporate profits and profit margins have inflected higher in nominal terms, and it’s reasonable to think that payrolls and wage growth may follow suit should this trend continue. Though down from its peak of 6.7%, wage inflation of 4.3% remains inconsistent with the Fed’s 2% inflation goal, and this stickiness is likely among the reasons why consumer price index (CPI) prints have stubbornly persisted above target even as other components have retreated.9
Exhibit 2. US Payrolls Continued to Expand Even as the Unemployment Rate Increased
January 2022 through November 2024

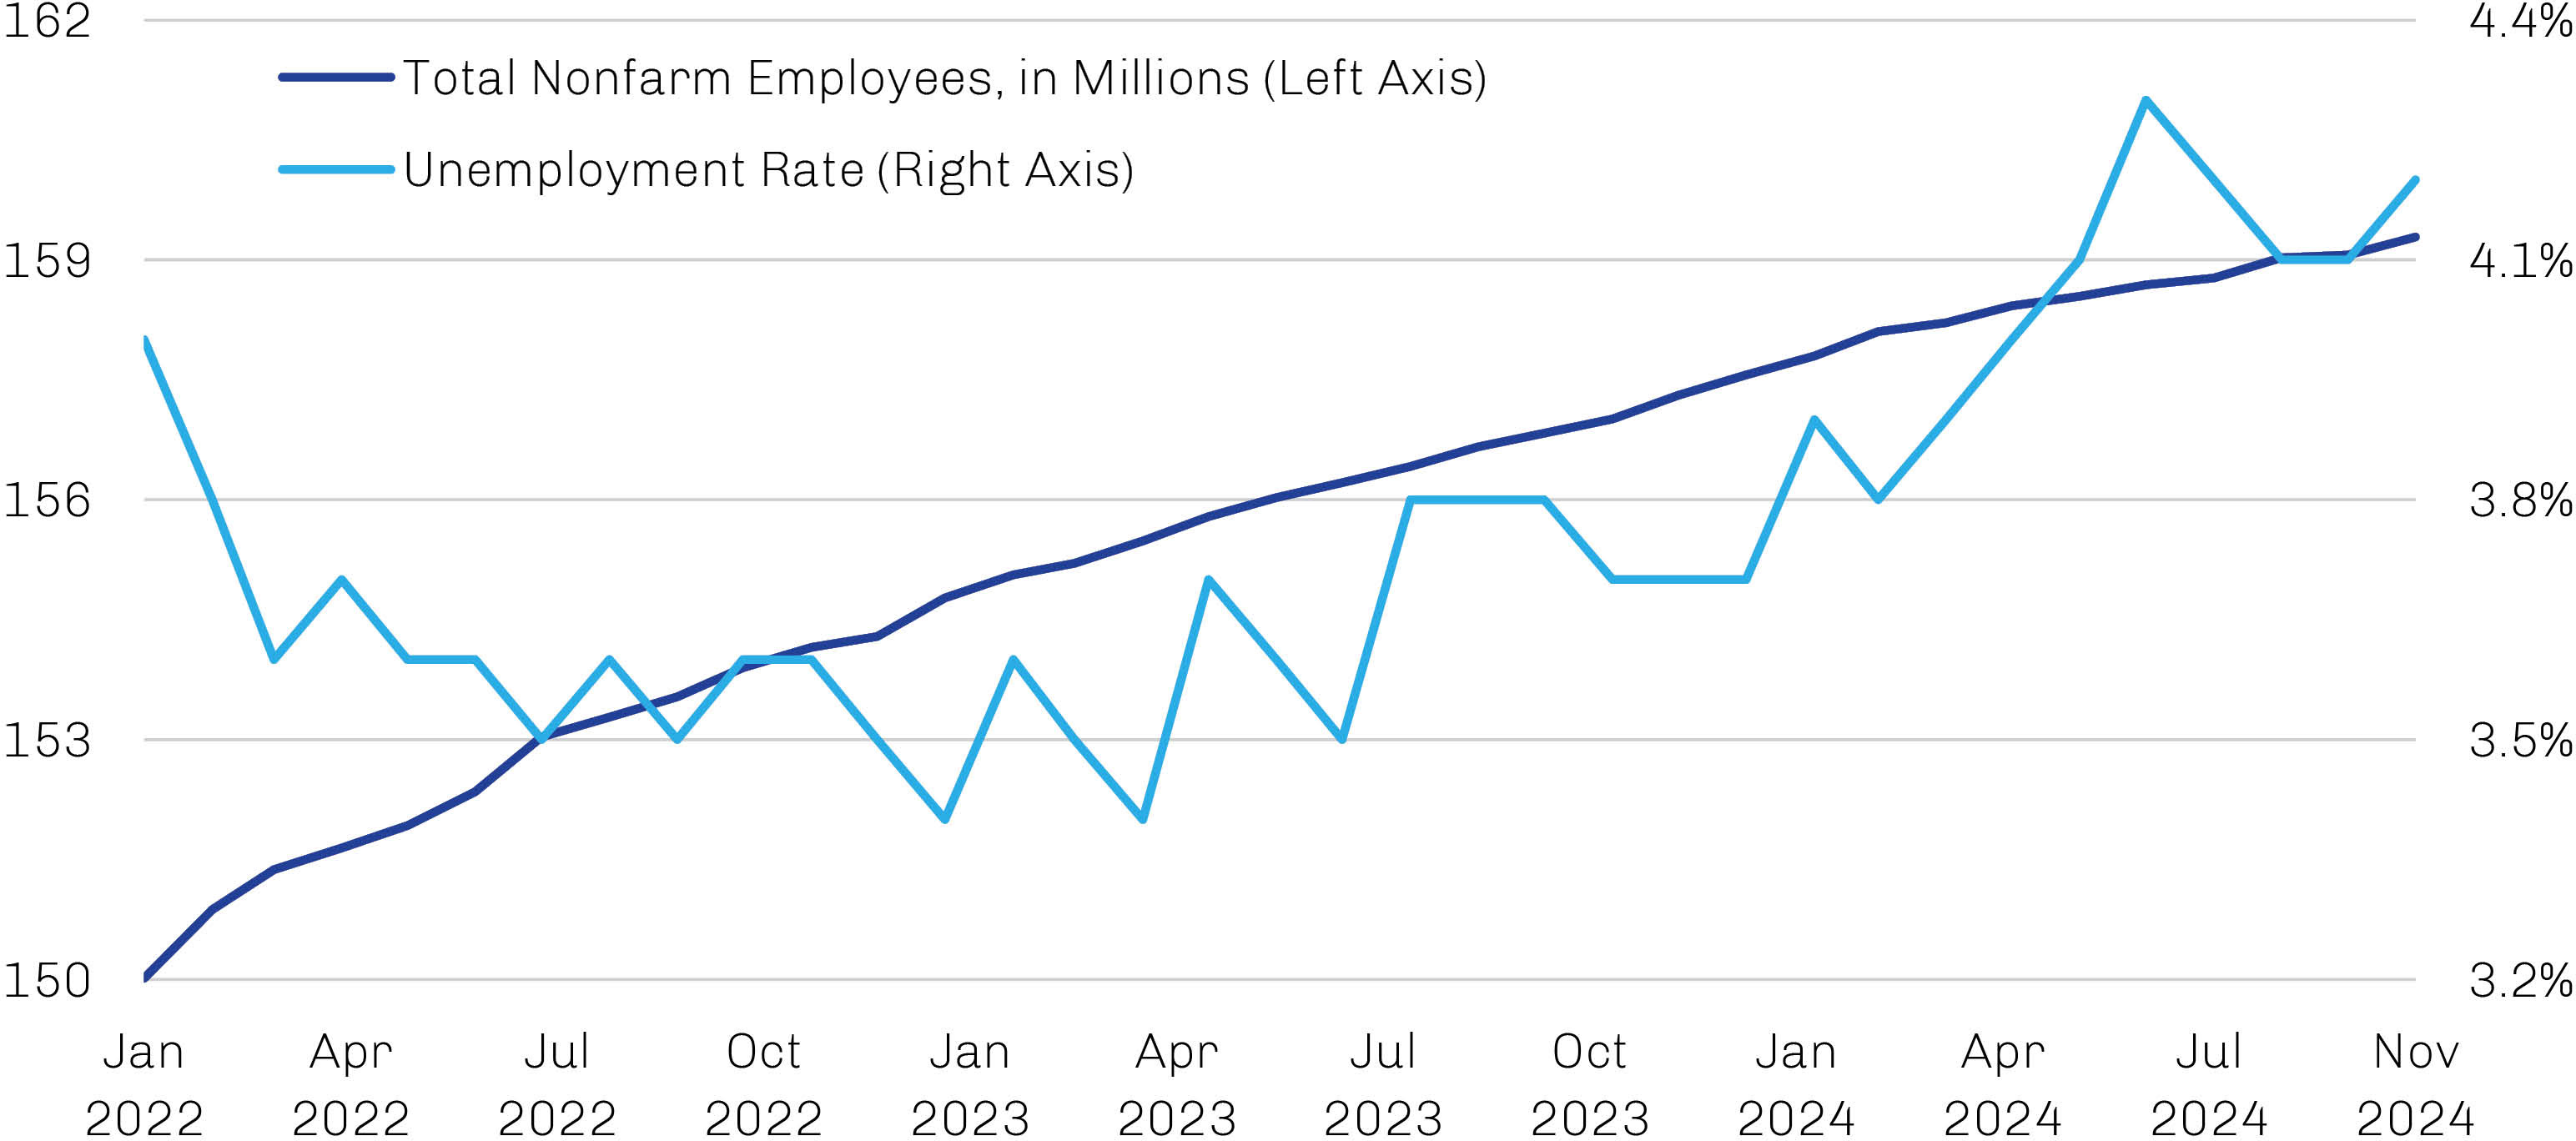
Source: US Bureau of Labor Statistics, Federal Reserve Board of St. Louis; data as of December 9, 2024.
Easing monetary policy presents another potential source of inflationary pressure. With the inflation rate well off its cyclical peak, the Fed in September began to recalibrate its settings, kicking off a much-anticipated rate-cut cycle with a 50 basis point reduction. The Fed followed up that move with two additional 25 basis point cuts in November and December to bring its key policy rate to 4.25–4.50% by year-end, and the latest summary of economic projections suggest an additional 50 basis points of cuts are coming in 2025.10 In response to easier policy, bank lending standards have gone from tight to neutral (as shown in Exhibit 3) and credit spreads have retreated. With market valuations high and earnings expectations buoyant, a Fed shift back to a hawkish policy bias sooner than expected could prompt investors to recalibrate their risk appetites and herald an untimely end to the US Goldilocks tale.
Exhibit 3. More Accommodative US Banks Highlight Easing Financial Conditions
Net Percentage of Domestic Banks Tightening Standards for Commercial and Industrial Loans to Large and Middle Market Firms, January 1990 through November 2024 
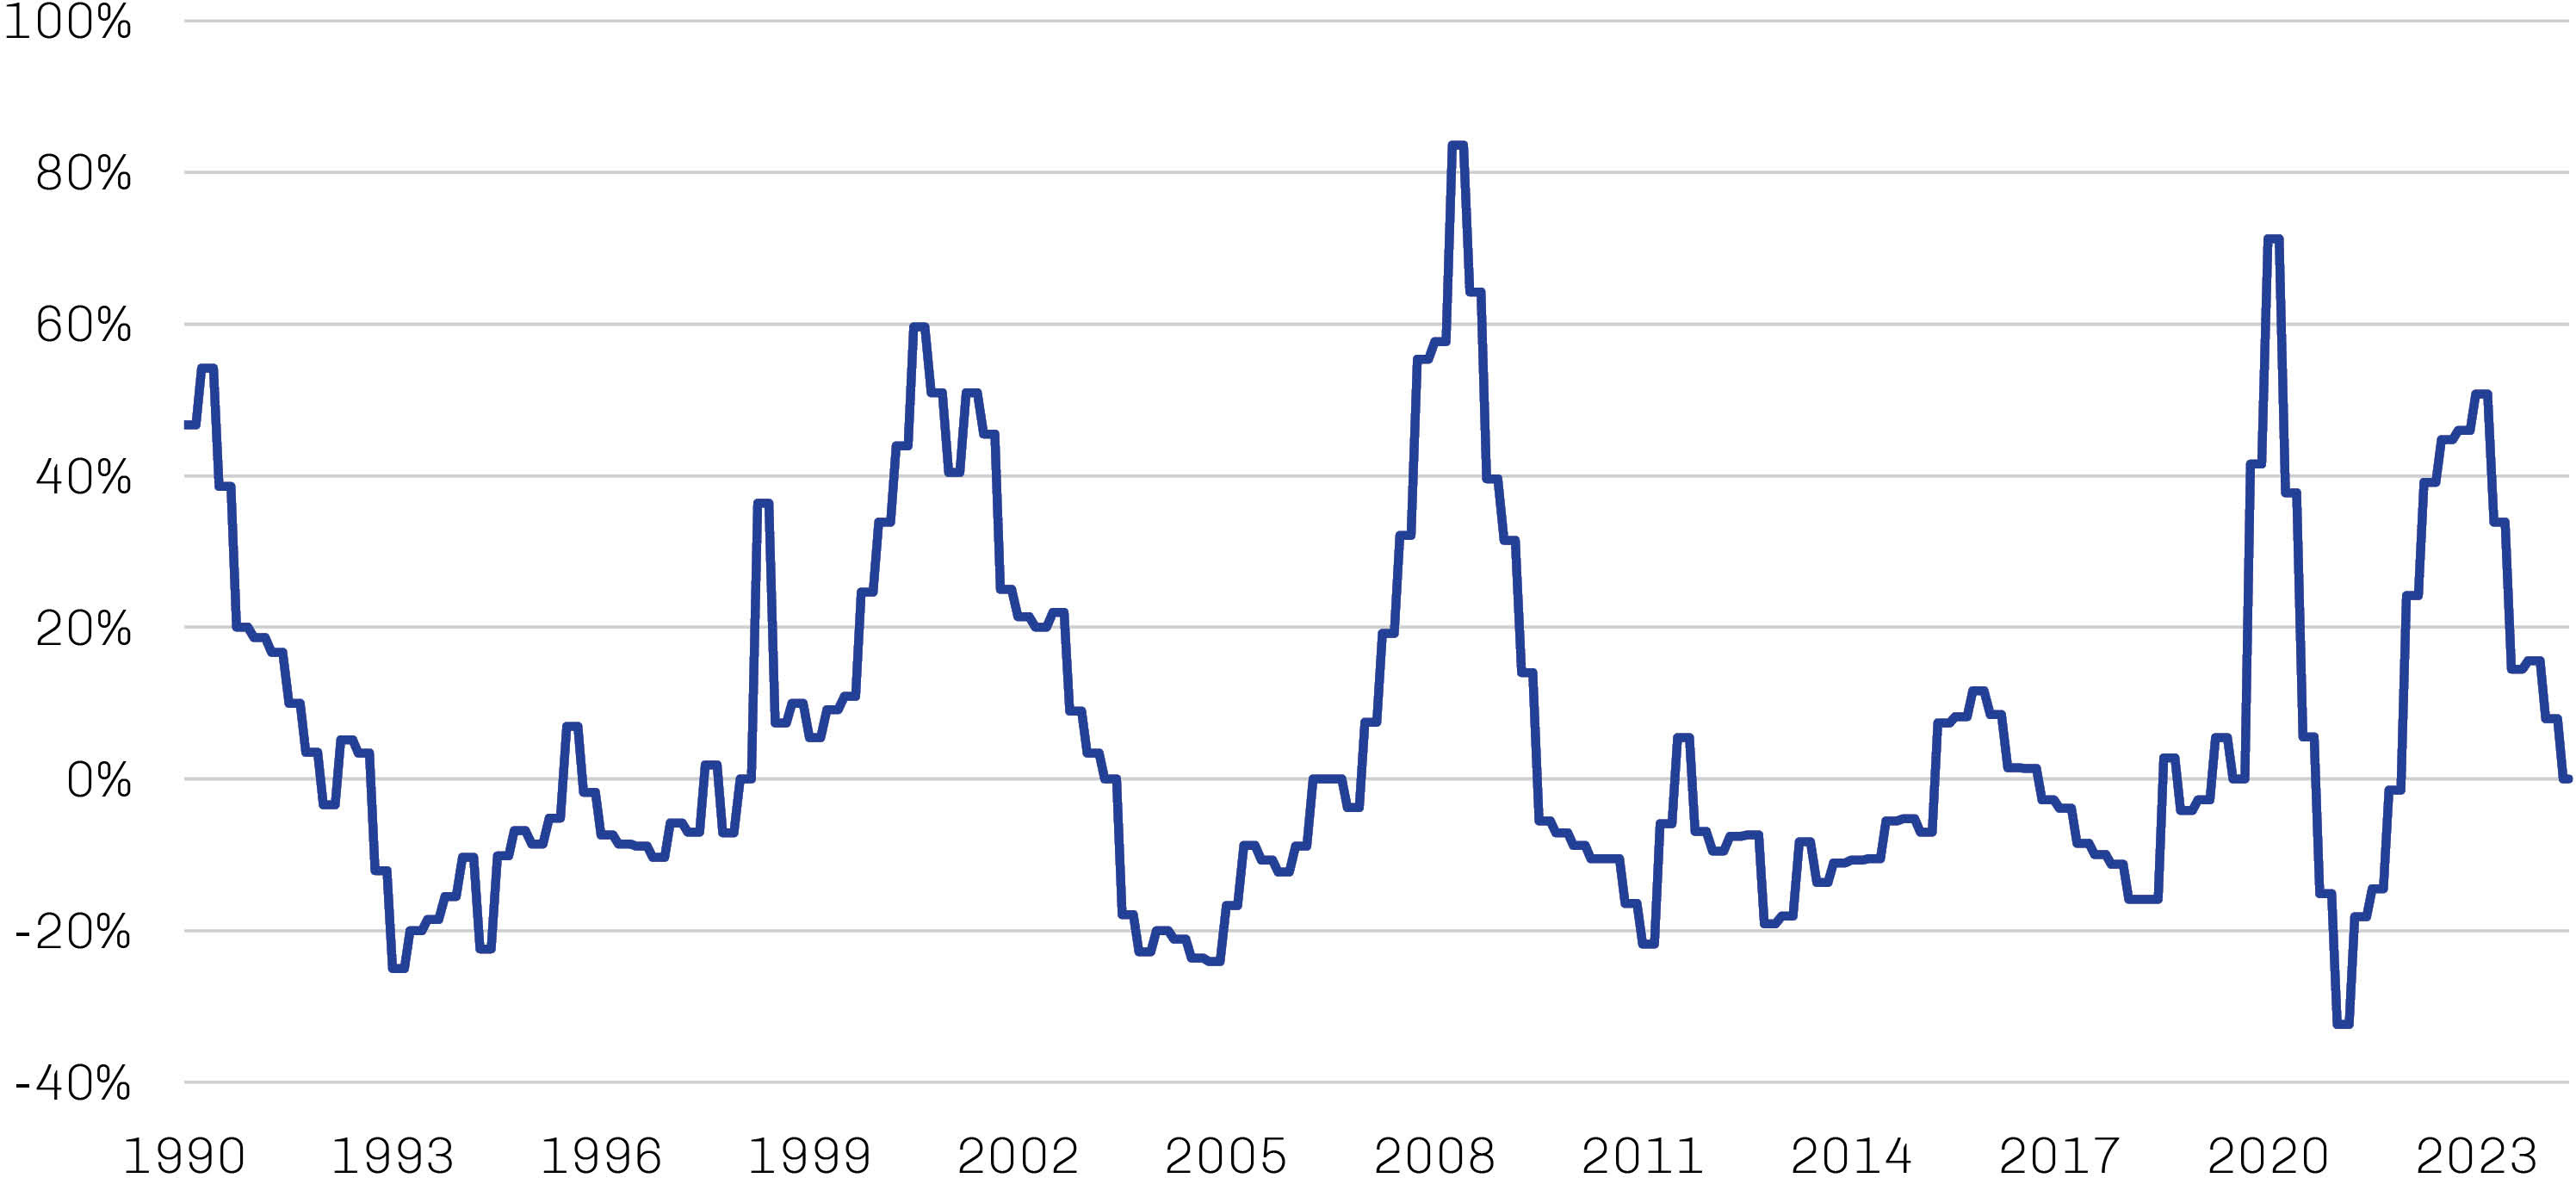
Source: Bloomberg; data as of November 30, 2024.
From Politicking to Policymaking
Though the US and China may be decoupling economically, their mutual affection for public debt persists, and their large and growing debt loads—not unique to them by any means—reflect long-term risks to financial stability even as they support near-term growth. Unrestrained government debt globally has raised the specter of currency debasement and other adverse financial outcomes, and the longer fiscal imbalances go unaddressed, in our view, the more difficult they will be to unwind.
In the US, the federal fiscal deficit expanded again in fiscal 2024 (ended September) to 6.4% of GDP and has only worsened since, coming in at 7.1% for the last 12 months through November; the 50-year average is 3.8%.11 While the policy specifics moving forward are uncertain given January’s leadership transition, higher deficits and debt levels seem likely under the incoming Trump administration (as they would have with a Harris victory).12
Gold: All That Glitters
Our belief that the future is inherently uncertain drives our commitment to a strategic exposure to gold as a potential hedge against adverse market outcomes. Such an approach has been particularly beneficial over the past several years, as gold demonstrated remarkable resilience in the face of conditions not typically associated with price appreciation, establishing a series of new nominal highs in the process.
We’ve noted previously that gold’s inverse relationship with real interest rates—i.e., the difference between the nominal interest rate and the expected rate of inflation—historically has been the most important driver of its price movements over time. While we continue to believe this to be true in the long run, the metal’s rally over the past few years is a compelling reminder that numerous factors can affect price movements in shorter time frames.
Gold’s reputation as a perceived “safe haven,” for example, often attracts buyers of all stripes during periods when threat recognition is high, and the past few years have certainly been one of those periods given the deteriorating geopolitical backdrop and large-scale armed conflicts in Russia/Ukraine and the Middle East. Meanwhile, the massive accumulation of debt by governments worldwide has increased concerns about the potential for currency debasement.
Global central banks are among the potential gold buyers sensitive to these issues, and in recent years they have very actively accumulated the metal in an effort to diversify their reserves, providing a key source of support for the gold price in the face of traditional headwinds. Net purchases of gold by central banks in 2022 and 2023 were the highest on record by far, and the first eleven months of 2024 were strong, if not quite at the pace of the previous two years. Financial buyers were slower to catch the gold bug, but a midyear 2024 pickup of inflows into physically backed gold ETFs—which capture investment demand from both institutional and individual investors —drove North America flow to their first positive year since 2020.¹
Notably, gold declined in the initial aftermath of the US presidential election while risk assets rallied sharply. Cryptocurrencies—and bitcoin, in particular—were among the biggest post-election gainers, pulled along by the slipstream of what is understood to be a crypto-friendly Trump administration. While it’s hard to draw conclusions from such a short period of performance, either positive or negative, we continue to view gold as the best potential hedge against the risks facing investment portfolios. Despite the latest round of risk-on enthusiasm for crypto and the potential for its regulatory legitimacy, in our view it remains an option on becoming digital gold—and thus an option on becoming a potential hedge asset—rather than a replacement for the time-tested store of value.
Source: World Gold Council; data as of January 10, 2025.
The Tax Cuts and Jobs Act of 2017, which will see many of its provisions for individual taxpayers expire at year-end 2025 absent Congressional action, is likely to take fiscal center stage next year. A unified Republican government suggests a high possibility that the Trump administration’s key tax priorities will be extended, but the means by which that lost revenue will be offset remain uncertain. A reduction of regulatory hurdles impairing business activity seems likely to promote investment and economic growth. Some in the administration—including Scott Bessent, Trump’s pick to run Treasury—have argued that tariffs “can increase revenue to the Treasury” if used strategically.¹³ But the Congressional Budget Office’s review of tariff increases in 2018–19 found that the initial boost in customs revenues soon declined as imports slowed and were sourced from countries subject to lower duties.14
Spending cuts are another avenue to reducing the deficit, and Trump tapped public notables Elon Musk and Vivek Ramaswamy to take on the challenge as co-heads of the Department of Government Efficiency (DOGE). While there is certainly room to cut federal spending and eliminate wastefulness, public discussion has been focused mostly on nondefense discretionary spending, which accounts for only about 15% of total federal outlays and has actually decreased slightly as a percentage of GDP in recent years, as shown in Exhibit 4. Any attempt to meaningfully move the needle on the country’s debt burden likely would require reforms to popular—and seemingly sacrosanct— entitlements like Social Security, Medicare and Medicaid. Mustering the necessary political will for changes to programs so broadly popular with voters seems like an insurmountable challenge. While there is also talk of slashing the government’s workforce of 2.3 million civilians located across all 50 states, their aggregate salary amounts to less than 1.5% of GDP.15
Exhibit 4. Nondefense Discretionary Spending Offers US Legislators Limited Savings Opportunities
Federal Spending by Category as a Percentage of GDP

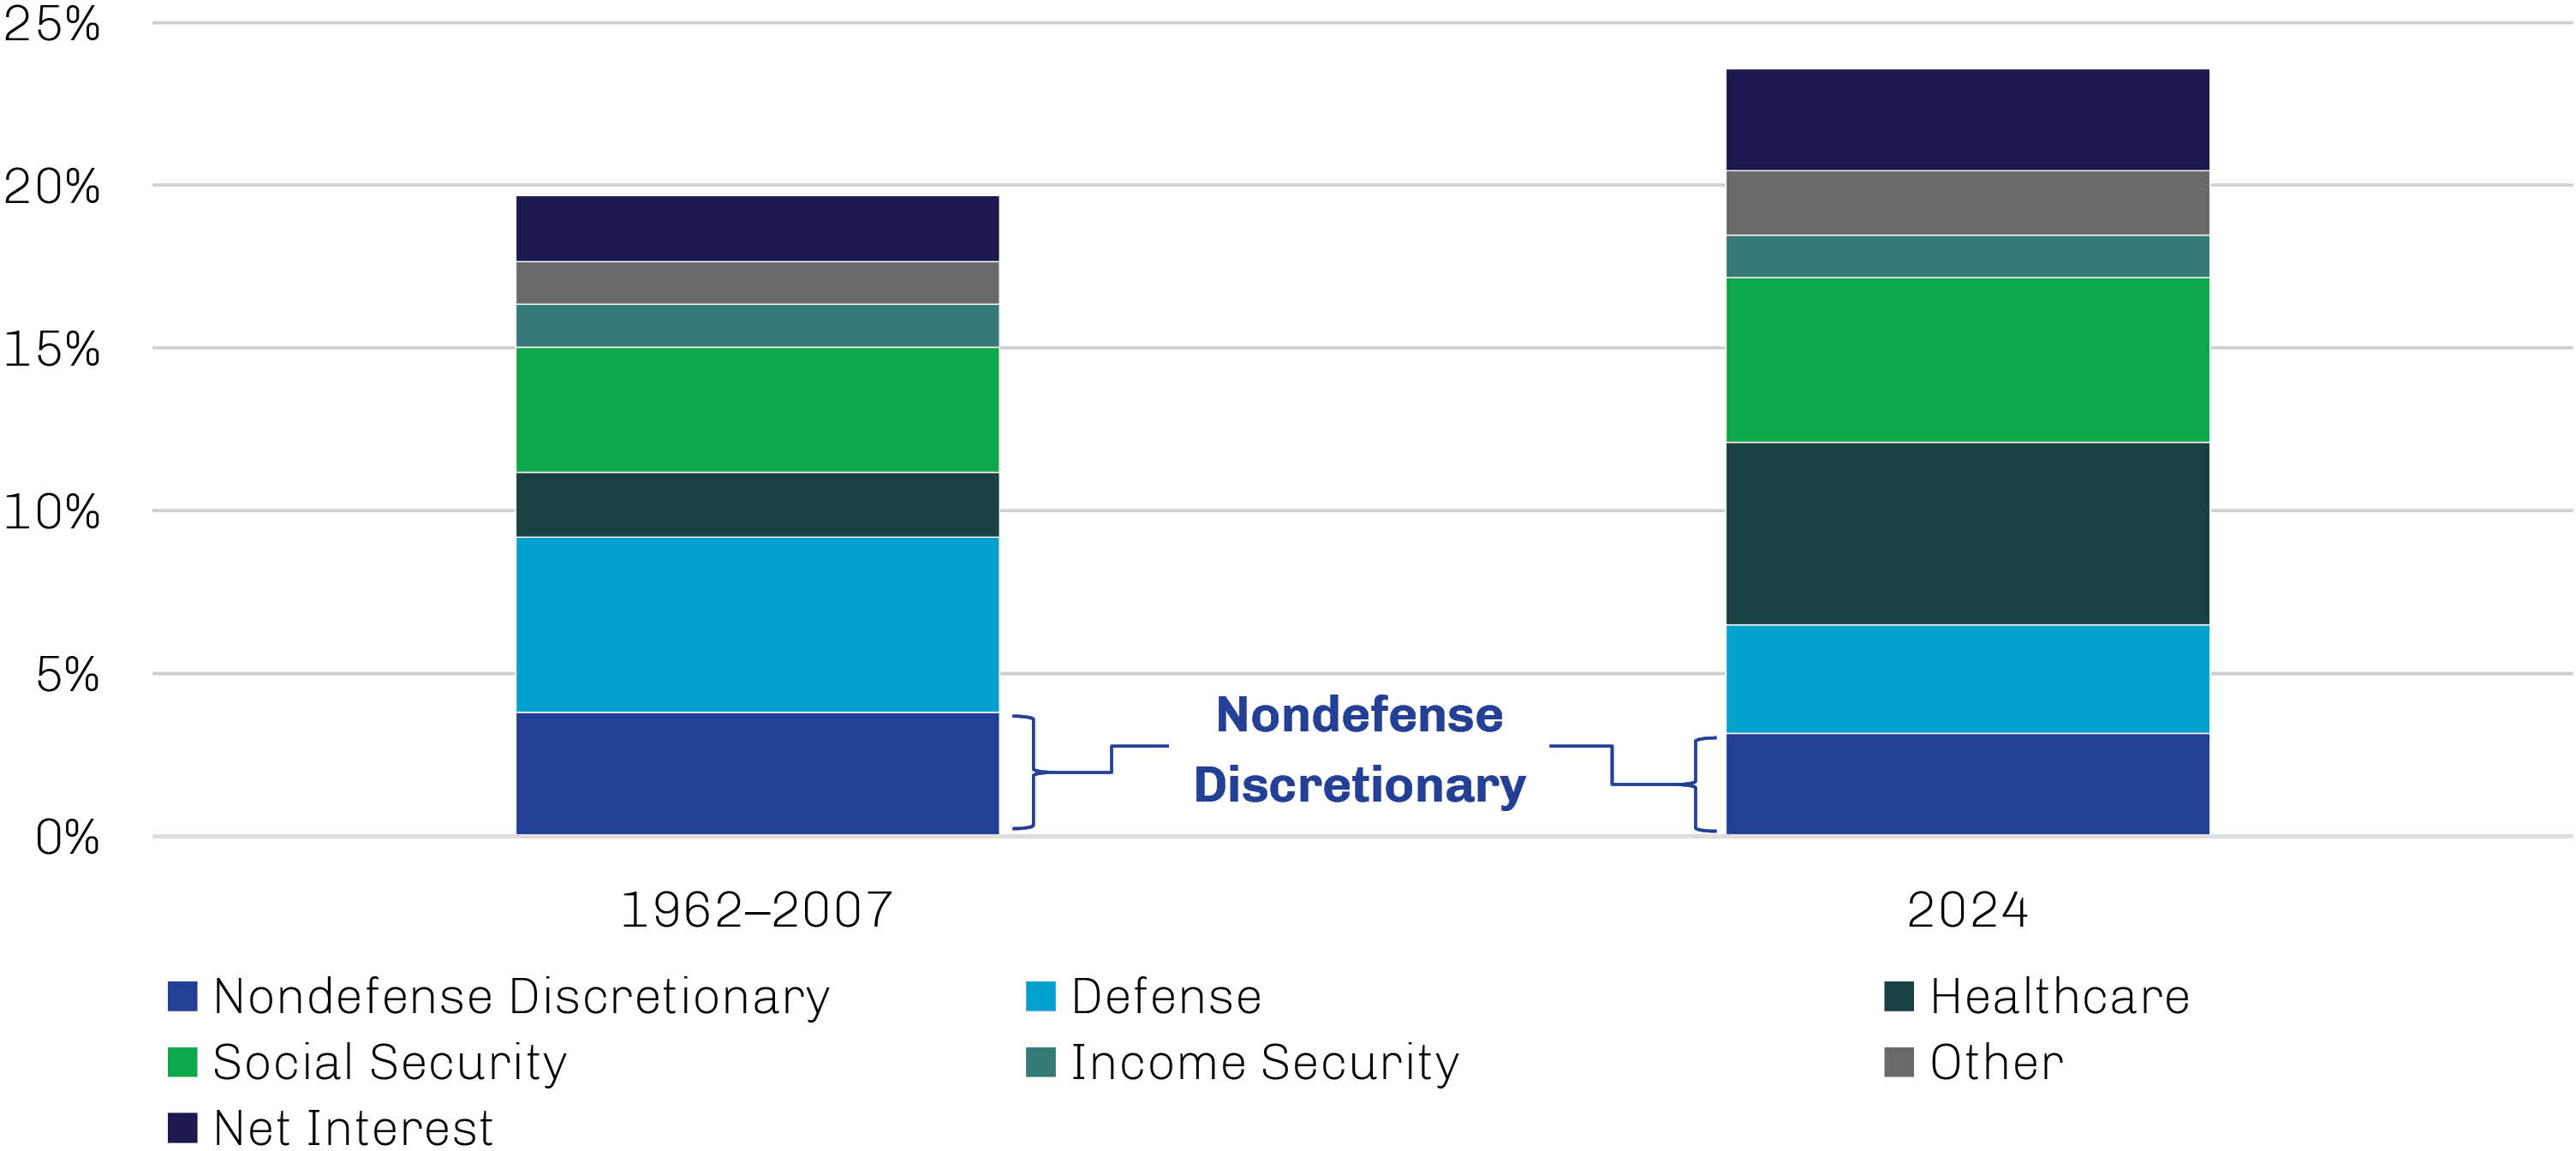
Source: US Department of the Treasury, US Bureau of Economic Analysis; data as of November 30, 2024.
Writing Our Own Narrative
Given equity market performance trends over the past two years, it can be tempting to ride the wave of “narrative economics” that has driven index-level performance. Economist Robert Shiller coined this term to describe the emerging stories that capture public attention and ultimately affect individual and collective behaviors—such as the investor enthusiasm around developments like artificial intelligence and GLP-1 agonists that has fueled a surge in narrow segments of the stock market over the past two years.16 While certain of these narratives are compelling, the valuations of those names overtly benefiting from them are generally less so.
As investors whose definition of risk is centered on avoiding the permanent impairment of capital rather than tracking error against a benchmark, the Global Value team remains focused on building portfolios that offer truly differentiated sources of risk and return and demonstrate perennial relevance. Selectivity is at the heart of our value-oriented investment process, and the flexibility of our mandate allows us to apply this selectivity to the global opportunity set from the bottom up. We look for assets we believe demonstrate scarce quality and value and invest in them only when we can do so at a “margin of safety.”17 Our stock selection often is complemented by a structural allocation to gold—a store of value for millennia—as a potential hedge against extreme market outcomes.
While we remain concerned about the many risks facing investors in the current environment, we also see opportunity. But rather than making concentrated bets on the direction of markets, we have continued to focus on investing in a diversified basket of individual assets we believe have the potential to demonstrate resilience across multiple states of the world.
1. The term “Magnificent Seven” is widely used in the financial media and elsewhere to refer to these seven US technology-related stocks that drove an outsized share of equity market gains in 2023 and 2024.
2. Source: Bloomberg; data as of December 31, 2024.
3. Niall Ferguson and Moritz Schularick, “’Chimerica’ and the Global Asset Market Boom,” International Finance (10:3, 2007).
4. Source: Bloomberg; data as of September 12, 2024.
5. Source: The Wall Street Journal; data as of October 26, 2023.
6. Source: MSCI, Bloomberg; data as of September 30, 2024.
7. Source: Reuters; data as of September 24, 2024.
8. Source: Reuters; data as of November 8, 2024.
9. Source: Federal Reserve Bank of Atlanta; data as of December 11, 2024.
10. Source: Federal Reserve; data as of September 18, 2024.
11. Source: Congressional Budget Office, Bloomberg ; data as of November 30, 2024.
12. Source: Committee for a Responsible Federal Budget; data as of October 25, 2024.
13. Source: Fox News; data as of November 15, 2024.
14. “How CBO Projects Tariff Revenues,” Congressional Budget Office (October 2024).
15. Source: The Wall Street Journal; data as of November 17, 2024
16. Robert J. Shiller, Narrative Economics: How Stories Go Viral and Drive Major Economic Events, Princeton University Press (October 2019).
17. First Eagle defines “margin of safety” as the difference between a company’s market price and our estimate of its intrinsic value.
The opinions expressed are not necessarily those of the firm. These materials are provided for informational purposes only. These opinions are not intended to be a forecast of future events, a guarantee of future results, or investment advice. Any statistics contained herein have been obtained from sources believed to be reliable, but the accuracy of this information cannot be guaranteed. The views expressed herein may change at any time subsequent to the date of issue hereof. The information provided is not to be construed as a recommendation to buy, hold or sell or the solicitation or an offer to buy or sell any fund or security.
Past performance is not indicative of future results.
Risk Disclosures
All investments involve the risk of loss of principal.
There are risks associated with investing in securities of foreign countries, such as erratic market conditions, economic and political instability and fluctuations in currency exchange rates.
A principal risk of investing in value stocks is that the price of the security may not approach its anticipated value or may decline in value. “Value” investments as a category, or entire industries or sectors associated with such investments, may lose favor with investors as compared to those that are more “growth” oriented.
The value and liquidity of portfolio holdings may fluctuate in response to events specific to the companies or markets, as well as economic, political or social events in the US or abroad. During periods of market volatility, the value of individual securities and other investments at times may decline significantly and rapidly. The securities of small and micro-size companies can be more volatile in price than those of larger companies and may be more difficult or expensive to trade.
There are risks associated with investing in foreign investments (including depositary receipts). Foreign investments, which can be denominated in foreign currencies, are susceptible to less politically, economically and socially stable environments; fluctuations in the value of foreign currency and exchange rates; and adverse changes to government regulations.
Investment in gold and gold-related investments present certain risks, including political and economic risks affecting the price of gold and other precious metals, like changes in US or foreign tax, currency or mining laws; increased environmental costs; international monetary and political policies; economic conditions within an individual country; trade imbalances; and trade or currency restrictions between countries. The price of gold, in turn, is likely to affect the market prices of securities of companies mining or processing gold and, accordingly, the value of investments in such securities may also be affected. Gold-related investments as a group have not performed as well as the stock market in general during periods when the US dollar is strong, inflation is low and general economic conditions are stable. In addition, returns on gold-related investments have traditionally been more volatile than investments in broader equity or debt markets. Investment in gold and gold-related investments may be speculative and may be subject to greater price volatility than investments in other assets and types of companies.
Municipal bonds are subject to credit risk, interest rate risk, liquidity risk and call risk. However, the obligations of some municipal issuers may not be enforceable through the exercise of traditional creditors’ rights. The reorganization under federal bankruptcy laws of a municipal bond issuer may result in the bonds being cancelled without payment or repaid only in part or in delays in collecting principal and interest.
The information is not intended to provide and should not be relied on for accounting or tax advice. Any tax information presented is not intended to constitute an analysis of all tax considerations.
Diversification does not guarantee investment returns and does not eliminate the risk of loss.
Alternative Investment Risks
Alternative investments can be speculative and are not suitable for all investors. Investing in alternative investments is only intended for experienced and sophisticated investors who are willing and able to bear the high economic risks associated with such an investment. Investors should carefully review and consider potential risks before investing. Certain of these risks include:
• Loss of all or a substantial portion of the investment;
• Lack of liquidity in that there may be no secondary market or interest in the strategy and none is expected to develop;
• Volatility of returns;
• Interest rate risk;
• Restrictions on transferring interests in a private investment strategy;
• Potential lack of diversification and resulting higher risk due to concentration within one or more sectors, industries, countries or regions;
• Absence of information regarding valuations and pricing;
• Complex tax structures and delays in tax reporting;
• Less regulation and higher fees than mutual funds;
• Use of leverage, which magnifies the potential for gain or loss on amounts invested and is generally considered a speculative investment technique and increases the risks associated with investing in the strategy;
• Carried interest, which may cause the strategy to make more speculative, higher-risk investments than would be the case in absence of such arrangements; and
• Below investment grade loans, which may default and adversely affect returns.
Indexes are unmanaged and one cannot invest directly in an index.
Bloomberg Municipal Bond Index (Gross/Total) measures the performance of the US municipal tax-exempt investment grade bond market. A total-return index tracks price changes and reinvestment of distribution income.
Bloomberg US Aggregate Bond Index (Gross/Total) measures the performance of the investment grade, US dollar-denominated, fixed-rate taxable bond market in the US, including Treasuries, government-related and corporate securities, fixed-rate agency MBS (agency fixed-rate and hybrid ARM passthroughs), ABS and CMBS. A total-return index tracks price changes and reinvestment of distribution income.
Bloomberg US Corporate Bond Index (Gross/Total) measures the performance of investment grade, fixed-rate, taxable corporate bond market. It includes US dollar denominated securities publicly issued by US and non-US industrial, utility and financial issuers. A total-return index tracks price changes and reinvestment of distribution income.
Bloomberg US Corporate High Yield Bond Index (Gross/Total) measures the US dollar-denominated, high yield, fixed-rate corporate bond market. Securities are classified as high yield if the middle rating of Moody’s, Fitch and S&P is Ba1/BB+/BB+ or below. A total-return index tracks price changes and reinvestment of distribution income.
Cliffwater Direct Lending Index is an asset-weighted index of US middle market direct loans.
Consumer price index (CPI) (Price) measures inflation as experienced by consumers in their day-to-day living expenses by capturing the average change over time in the prices paid for a representative basket of consumer goods and services. A price-return index only measures price changes.
Fannie Mae Home Purchase Sentiment Index (HPSI) (Gross/Total) distills consumer responses to Fannie Mae’s monthly National Housing Survey into a single indicator designed to provide signals on future housing outcomes. A total-return index tracks price changes and reinvestment of distribution income.
ICE BofA AA-BBB US Fixed Rate Automobile ABS Index (Gross/Total) measures the performance of asset-backed securities collateralized by automobile loans with a middle rating in a range of AA/Aa to BBB/Baa as measured Moody’s, Fitch and S&P. A total-return index tracks price changes and reinvestment of distribution income.
ICE BofA AA-BBB US Floating Rate Credit Card ABS Index (Gross/Total) measures the performance of asset-backed securities collateralized by credit card loans with a middle rating in a range of AA/Aa to BBB/Baa as measured Moody’s, Fitch and S&P. A total-return index tracks price changes and reinvestment of distribution income.
ICE BofA AA-BBB US Floating Rate Student Loan ABS Index (Gross/Total) measures the performance of asset-backed securities collateralized by student loans with a middle rating in a range of AA/Aa to BBB/Baa as measured Moody’s, Fitch and S&P. A total-return index tracks price changes and reinvestment of distribution income.
ICE BofA Current 10-Year US Treasury Index measures the performance of US Treasury securities with a remaining maturity exceeding seven years and less than or equal to 10 years. A total-return index tracks price changes and reinvestment of distribution income.
Morningstar LSTA US Leveraged Loan Index (Gross/Total) is a market value-weighted index that measures the performance of the US leveraged loan market. A total-return index tracks price changes and reinvestment of distribution income.
MSCI China Index (Net) measures the performance of large and midcap representation across China A shares, H shares, B shares, Red chips, P chips and foreign listings. A net-return index tracks price changes and reinvestment of distribution income net of withholding taxes.
MSCI World Index (Net) measures the performance of large and midcap equities across developed markets. A net-return index tracks price changes and reinvestment of distribution income net of withholding taxes.
Palmer Square CLO AAA Index (Gross/Total) is a subindex of the Palmer Square CLO Debt Index that tracks only CLOs originally rated AAA. A total-return index tracks price changes and reinvestment of distribution income.
Palmer Square CLO BBB Index (Gross/Total) is a subindex of the Palmer Square CLO Debt Index that tracks only CLOs originally rated BBB. A total-return index tracks price changes and reinvestment of distribution income.
Russell 2000® Index (Gross/Total) measures the performance of the small cap segment of the US equity universe. It includes approximately 2,000 of the smallest securities based on a combination of their market cap and current index membership. A total-return index tracks price changes and reinvestment of distribution income.
S&P 500 Index (Gross/Total) measures the performance of 500 of the top companies in the leading industries of the US economy and is widely recognized as a proxy for the US market as a whole. A total-return index tracks price changes and reinvestment of distribution income.
S&P Municipal Bond High Yield Index (Gross/Total) measures the performance of bonds in the S&P Municipal Bond Index that are not rated or whose ratings are below investment grade. A total-return index tracks price changes and reinvestment of distribution income.
S&P Municipal Yield Index (Gross/Total) measures the performance of high yield and investment grade municipal bonds. A total-return index tracks price changes and reinvestment of distribution income.
Definitions
A 10-year Treasury note is a debt obligation of the US government with a maturity of 10 years upon issuance.
AA credit rating—as used by S&P Global Ratings and Fitch Ratings—is an investment grade rating on a bond considered to have a very strong capacity to meet its financial commitments. The equivalent rating from Moody’s Investors Service is Aa.
AAA credit rating—as used by S&P Global Ratings and Fitch Ratings—is an investment grade rating on a bond considered to have an extremely strong capacity to meet its financial commitments. The equivalent rating from Moody’s Investors Service is Aaa.
Asset-based lending (ABL) is corporate borrowing supported by specific assets of the borrower rather than its cash flows.
BBB credit rating—as used by S&P Global Ratings and Fitch Ratings—is an investment grade rating on a bond considered to have adequate capacity to meet its financial commitments but that is more susceptible to adverse business, financial and economic conditions. The equivalent rating from Moody’s Investors Service is Baa.
Beta is a measure of an investment’s price volatility relative to that of the overall market.
A bull market is generally defined as a period during which a securities market index rises by 20% or more.
A business development company is a closed-end investment vehicle that invests in early stage and/or distressed small and medium- sized companies.
Collateralized loan obligations (CLO) are financial instruments collateralized by a pool of corporate loans.
Collective investment funds (CIFs), also known as collective investment trusts (CITs), are bank-administered trusts that hold commingled assets.
A credit rating is an assessment provided by a nationally recognized statistical rating organization (NRSRO) of the creditworthiness of an issuer with respect to debt obligations, including specific securities, money market instruments or other bonds. Ratings are measured on a scale that generally ranges from AAA/Aaa (highest) to D/RD (lowest); ratings are subject to change without notice. Not rated (NR) indicates that the debtor was not rated and should not be interpreted as indicating low quality.
Credit-risk transfer (CRT) securities are synthetic securitizations that reference the credit risk of a designated group of mortgage loans guaranteed by Fannie Mae or Freddie Mac.
Currency debasement refers to the reduction of a currency’s purchasing power.
Direct lending refers to a loan agreement between a borrower and single lender or small group of lenders. Direct lending can also be referred to as “private credit” or “private lending.”
Exchange-traded funds (ETFs) are listed investment vehicles that seek to provide exposure to a benchmark, index or actively managed strategy.
Federal funds rate is the interest rate at which depository institutions (banks and credit unions) lend reserve balances to other depository institutions overnight on an uncollateralized basis.
General obligation bonds are municipal securities in which payments are backed by the full faith and credit of the issuer and by extension its ability to tax its residents.
A Goldilocks economic scenario refers to a level of growth that is neither strong enough to promote inflation pressures nor weak enough to suggest recession may be near.
Government-sponsored enterprises (GSEs) were established and chartered by the US federal government for public policy purposes. They are private companies, and their securities are not backed by the full faith and credit of the federal government.
High yield municipal bonds are debt securities issued by states, cities, counties and other public entities that offer a higher rate of interest due to their perceived higher risk of default.
An interval fund is a pooled investment vehicle that offers investors periodic liquidity at an interval specified in its prospectus.
Moody’s Investors Service is a nationally recognized statistical rating organization (NRSRO) of the creditworthiness of an issuer with respect to debt obligations, including specific securities, money market instruments or other bonds. Ratings are measured on a scale that generally ranges from Aaa (highest) to RD (lowest); ratings are subject to change without notice.
Mortgage-backed securities (MBS) are debt securities whose payments of principal and interest are backed by the cash flow generated by pools of mortgage loans.
Net orderly liquidation value (NOLV) is the estimated proceeds from selling a borrower’s collateral assets in an orderly manner, including a reasonable amount of time to find a buyer, after all costs related to the sale.
Not rated (NR) indicates that the debtor was not rated and should not be interpreted as indicating low quality.
A private fund is a pooled investment vehicle that is not required to be registered or regulated as an investment company under the Investment Company Act of 1940, as amended.
Revenue bonds are municipal securities whose payments are backed not by a government’s taxing power but by revenues from a specific project or source, such as highway tolls or lease fees.
Secured Overnight Financing Rate (SOFR) is a broad measure of the cost of borrowing cash overnight collateralized by Treasury securities.
A separately managed account (SMA) is a portfolio of securities that is managed by a professional investment firm.
A soft landing refers to a gradual economic slowdown that comes to an end without triggering a recession.
Sovereign debt refers to debt obligations issued by a country’s government as a means to borrow capital.
S&P Global Ratings is a nationally recognized statistical rating organization (NRSRO) of the creditworthiness of an issuer with respect to debt obligations, including specific securities, money market instruments, or other bonds. Ratings are measured on a scale that generally ranges from AAA (highest) to D (lowest); ratings are subject to change without notice.
A tranche is a portion of a security issue with its own unique risk/reward characteristics and credit rating.
Undertakings for Collective Investment in Transferable Securities (UCITs) are pooled investment vehicles registered in countries in the European Union.
Volatility represents the degree to which an investment’s price has deviated from its average over time.
A yield curve is a graphical representation of interest rates on debt of equal credit quality across a range of maturities.
FEF Distributors, LLC (“FEFD”) (SIPC), a limited purpose broker-dealer, distributes certain First Eagle products. FEFD does not provide services to any investor, but rather provides services to its First Eagle affiliates. As such, when FEFD presents a fund, strategy or other product to a prospective investor, FEFD and its representatives do not determine whether an investment in the fund, strategy or other product is in the best interests of, or is otherwise beneficial or suitable for, the investor. No statement by FEFD should be construed as a recommendation. Investors should exercise their own judgment and/or consult with a financial professional to determine whether it is advisable for the investor to invest in any First Eagle fund, strategy, or product.
First Eagle Investments is the brand name for First Eagle Investment Management, LLC and its subsidiary investment advisers.
©2025 First Eagle Investment Management, LLC. All rights reserved.