Macro & Market Views
Homing in on Residential Real Estate Debt
Reflections 2024-2025
With supply constrained and demand persistent amid high home prices and high mortgage rates, the secular themes supporting the US housing market remain intact. Napier Park’s Head of Real Estate Debt Strategies Rajesh Agarwal and Managing Director Tim Ruberti discuss why they believe the current environment favors private investment opportunities in real estate specialty lending.
US Residential Real Estate Market Remains Imbalanced
The supply of housing in the US has grown increasingly strained in the years following the global financial crisis, as a credit crunch amid the turmoil of that period prompted a massive decline in housing starts from which the construction industry has yet to fully recover. The demand side of the equation, meanwhile, has been well supported by unabated household formation. As shown in Exhibit 1, the number of US households has doubled since 1970 while housing starts remain stuck at the same level.
Exhibit 1. New Housing Supply Has Lagged Household Formation for Most of This Century
In Thousands, 1959 through 2023

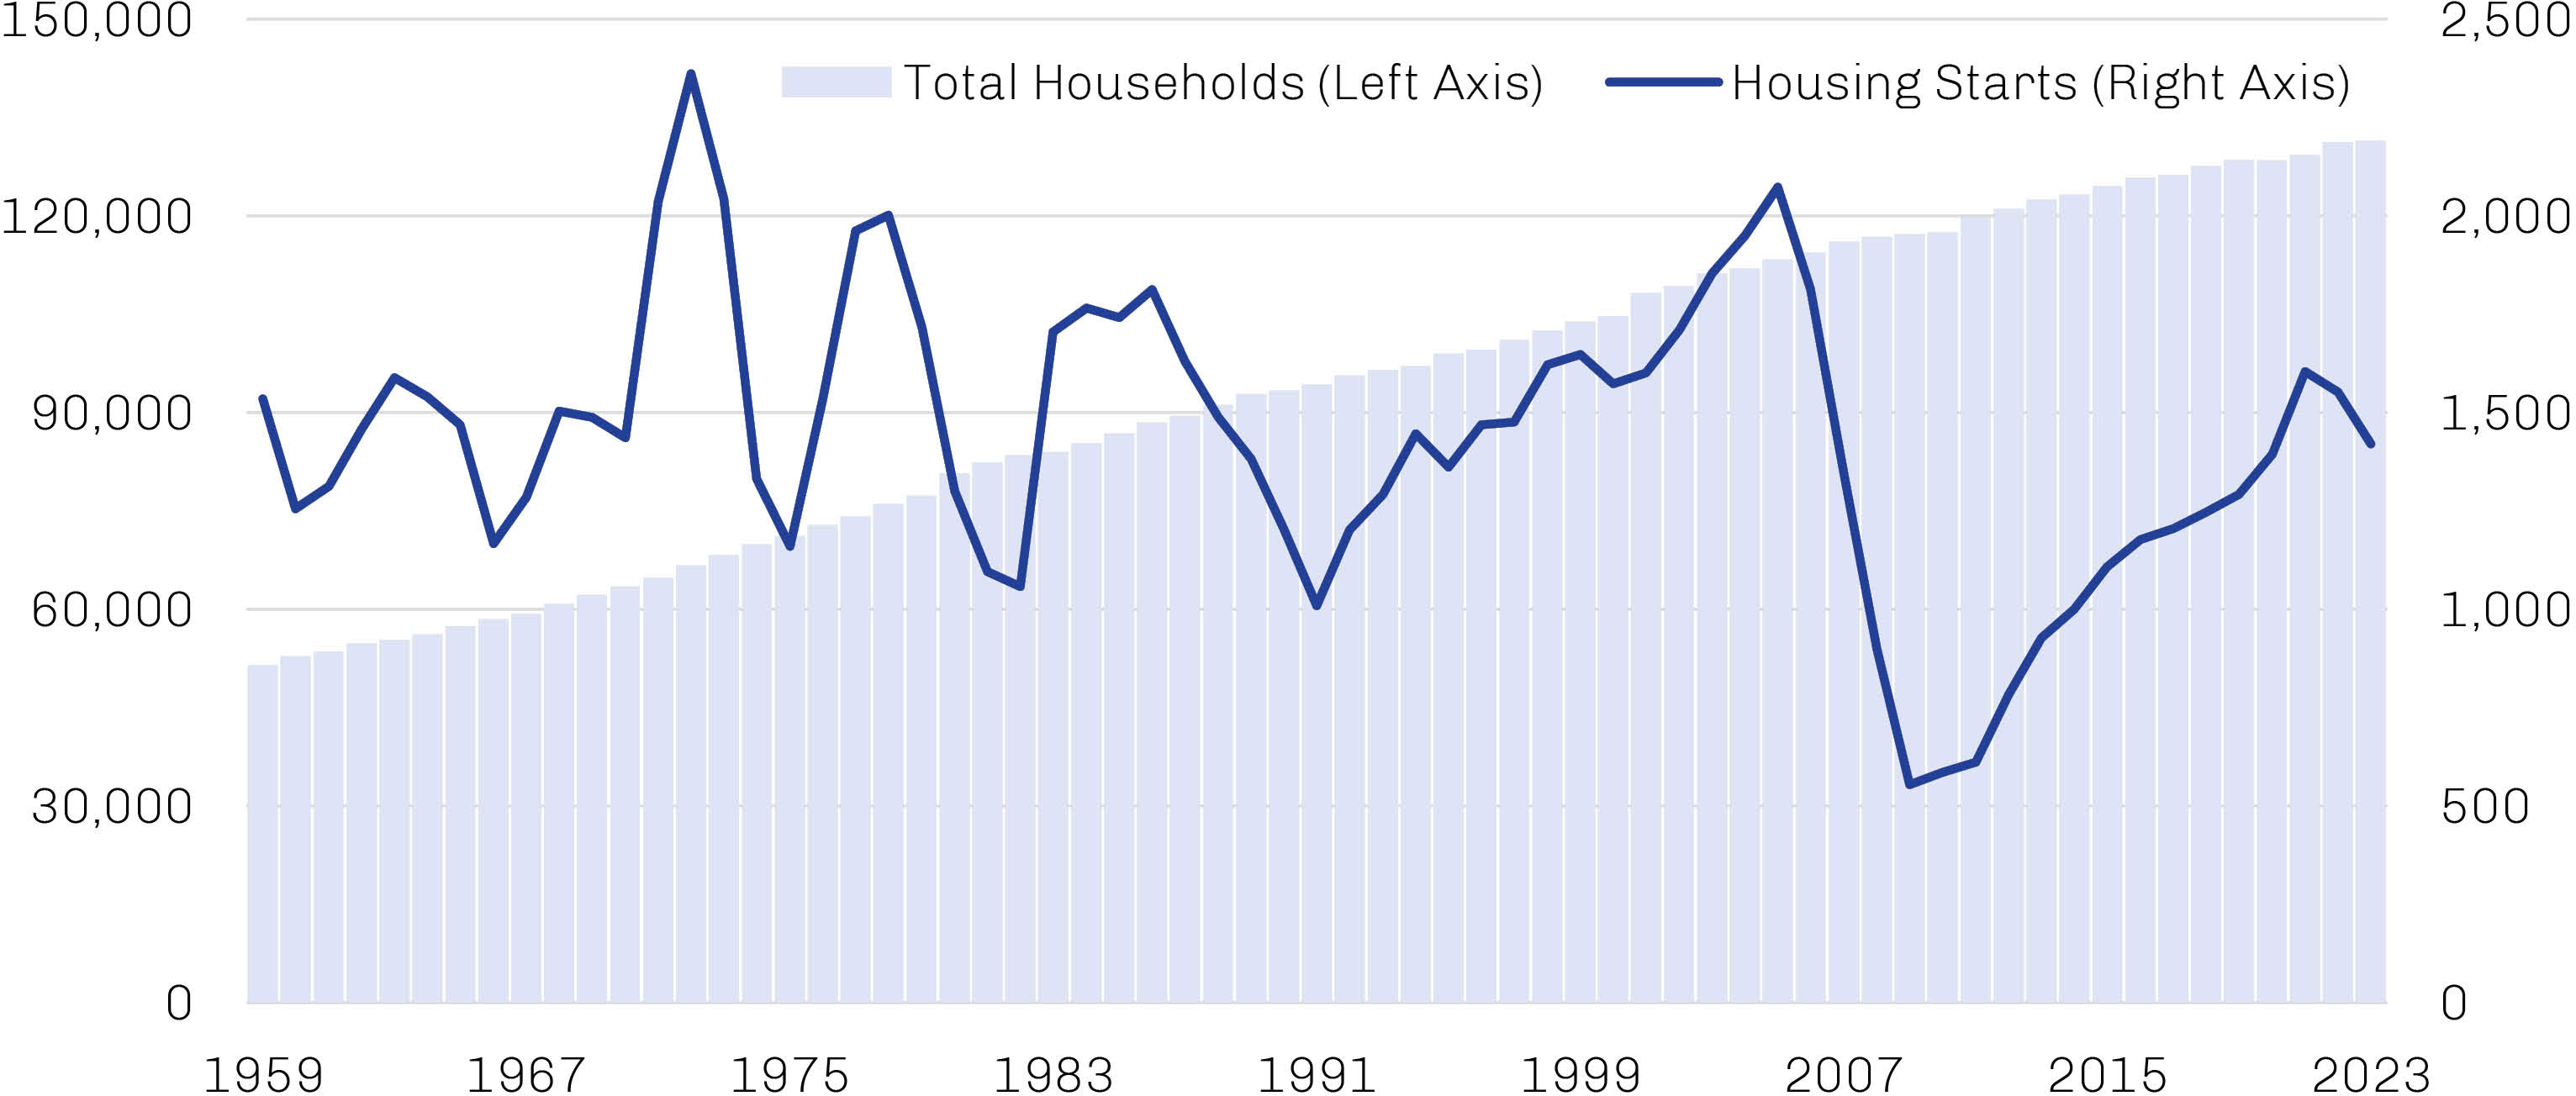
Source: Federal Reserve; data as of December 31, 2023.
The impact of new-home underbuilding has been exacerbated by the limited supply of existing homes for sale. This is primarily due to the “lock-in effect” of the higher mortgage rate regime, as demonstrated in Exhibit 2. Though the 30-year fixed-rate mortgage ended 2024 down from 2023’s peaks, it far exceeds the 4% average on existing mortgages and remains a significant disincentive to sell.1 This locked-in cohort includes many of the country’s 65 million baby boomers, who account for 36% of homeowner households in the US; a recent survey found that nearly 70% of this group plan to age in place in their current homes.2
Exhibit 2. Much Higher Interest Rates on New Mortgages Have “Locked In” Current Homeowners
30-Year Fixed-Rate Mortgage Average, January 2000 through December 2024

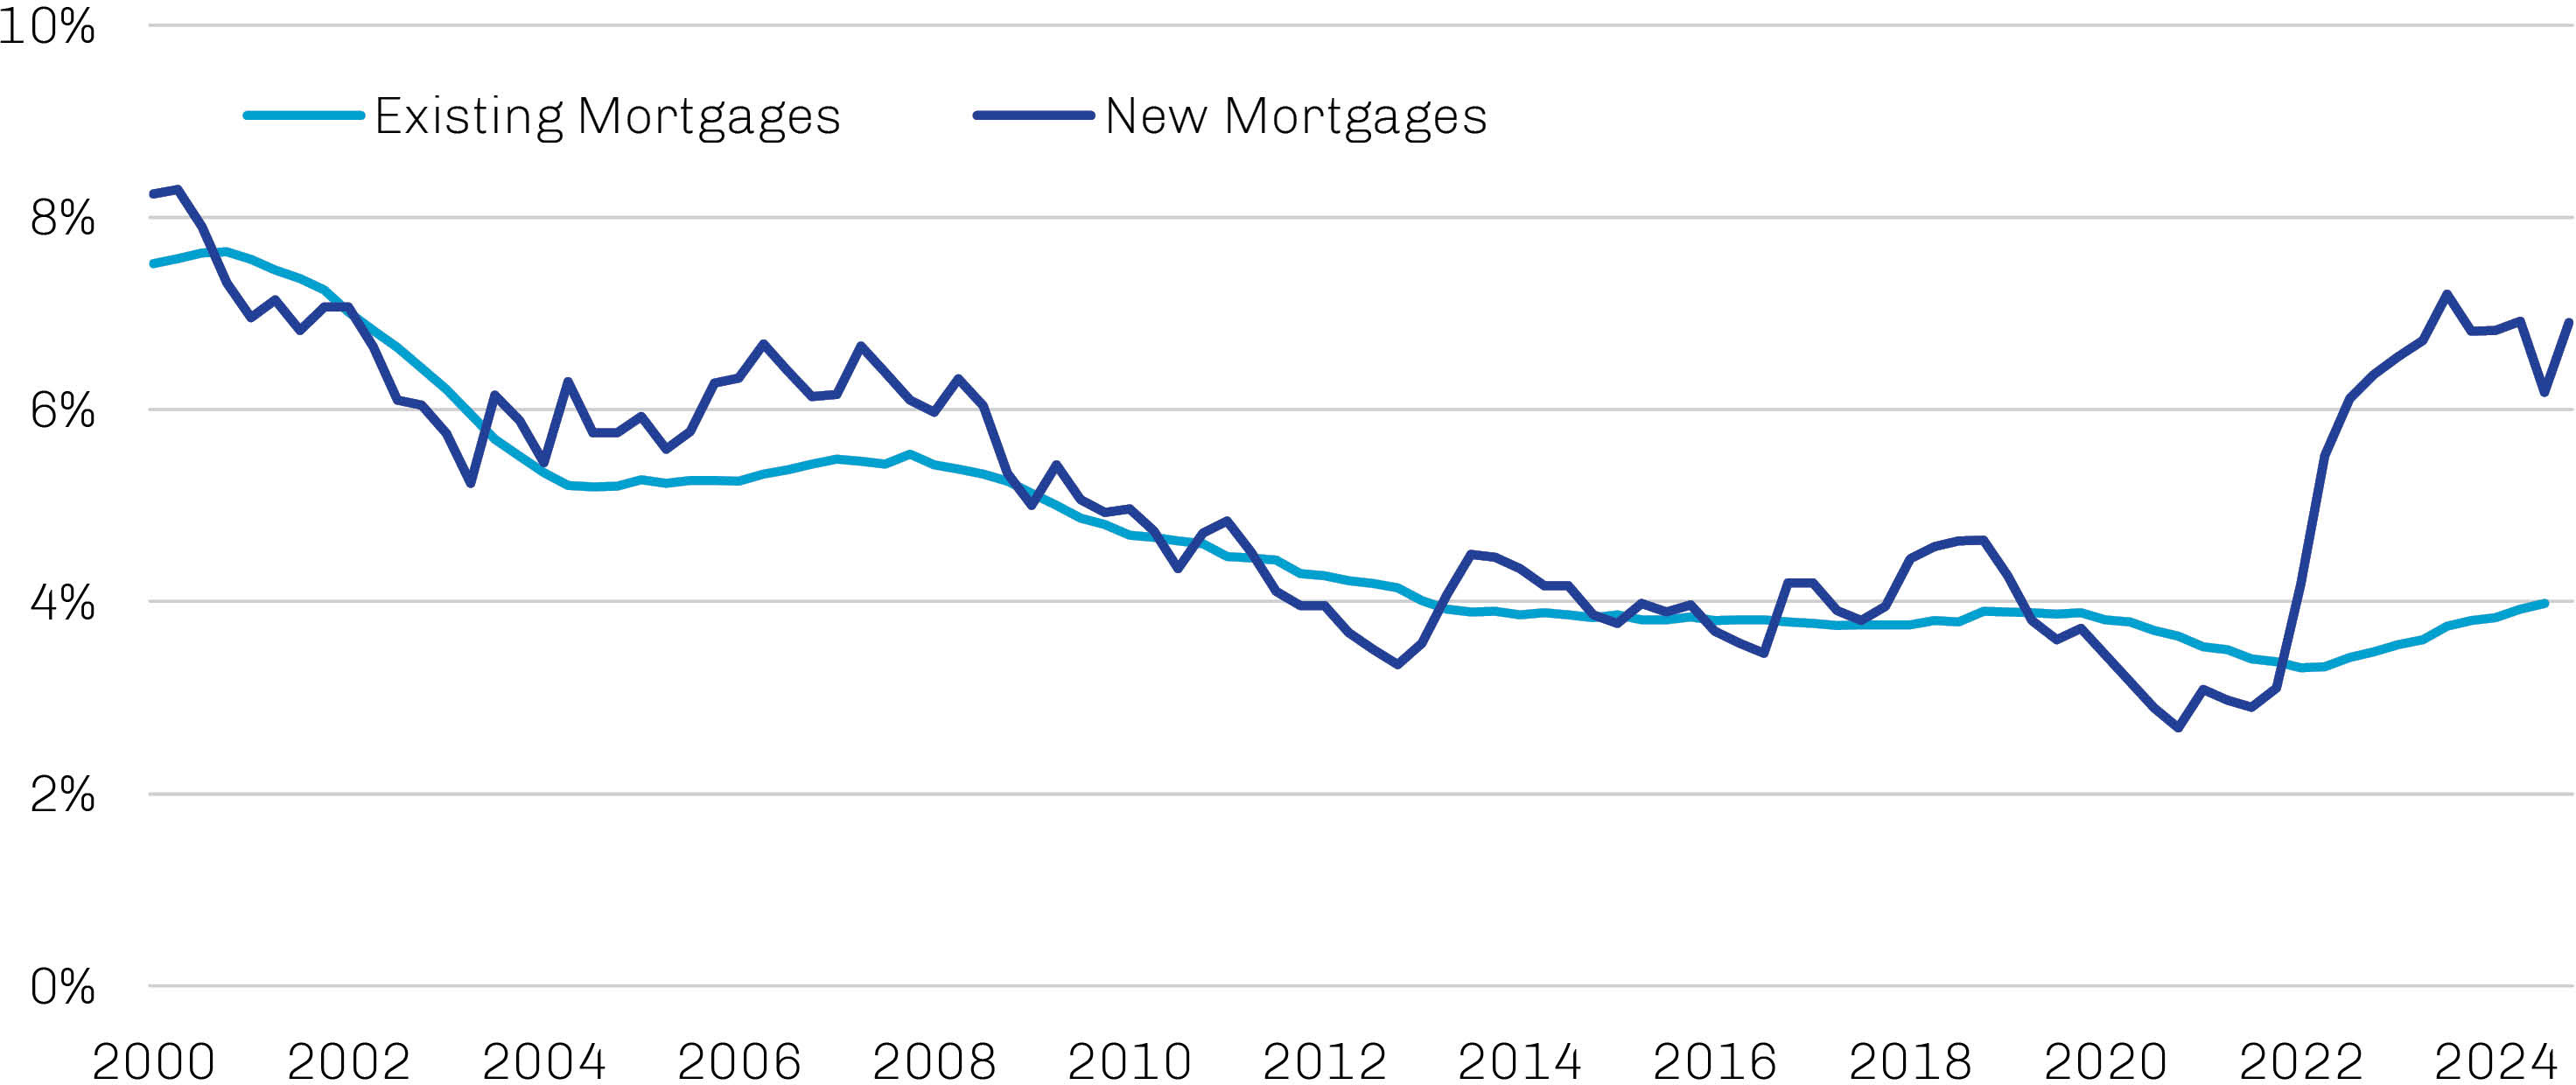
Source: Morgan Stanley Research, National Association of Realtors, Freddie Mac, US Census Bureau, Bureau of Labor Statistics; data as of December 26, 2024. Reflects latest available data for each series.
Housing demand remains well supported by consumer fundamentals, which, together with a shortage in supply, have buoyed home prices. Household net worth stands at a record high, debt levels remain manageable even off Covid-19-era lows, and indicators of consumer confidence have been biased higher.3 This is evidenced in Exhibit 3 by Fannie Mae’s Home Purchase Sentiment Index, which has reclaimed levels consistent with pre-tightening trends as consumers acclimate to the environment of higher home prices and higher mortgage rates.
Exhibit 3. Consumer Housing Sentiment Has Rebounded from All-Time Lows
Fannie Mae Home Purchase Sentiment Index, December 2019 through December 2024

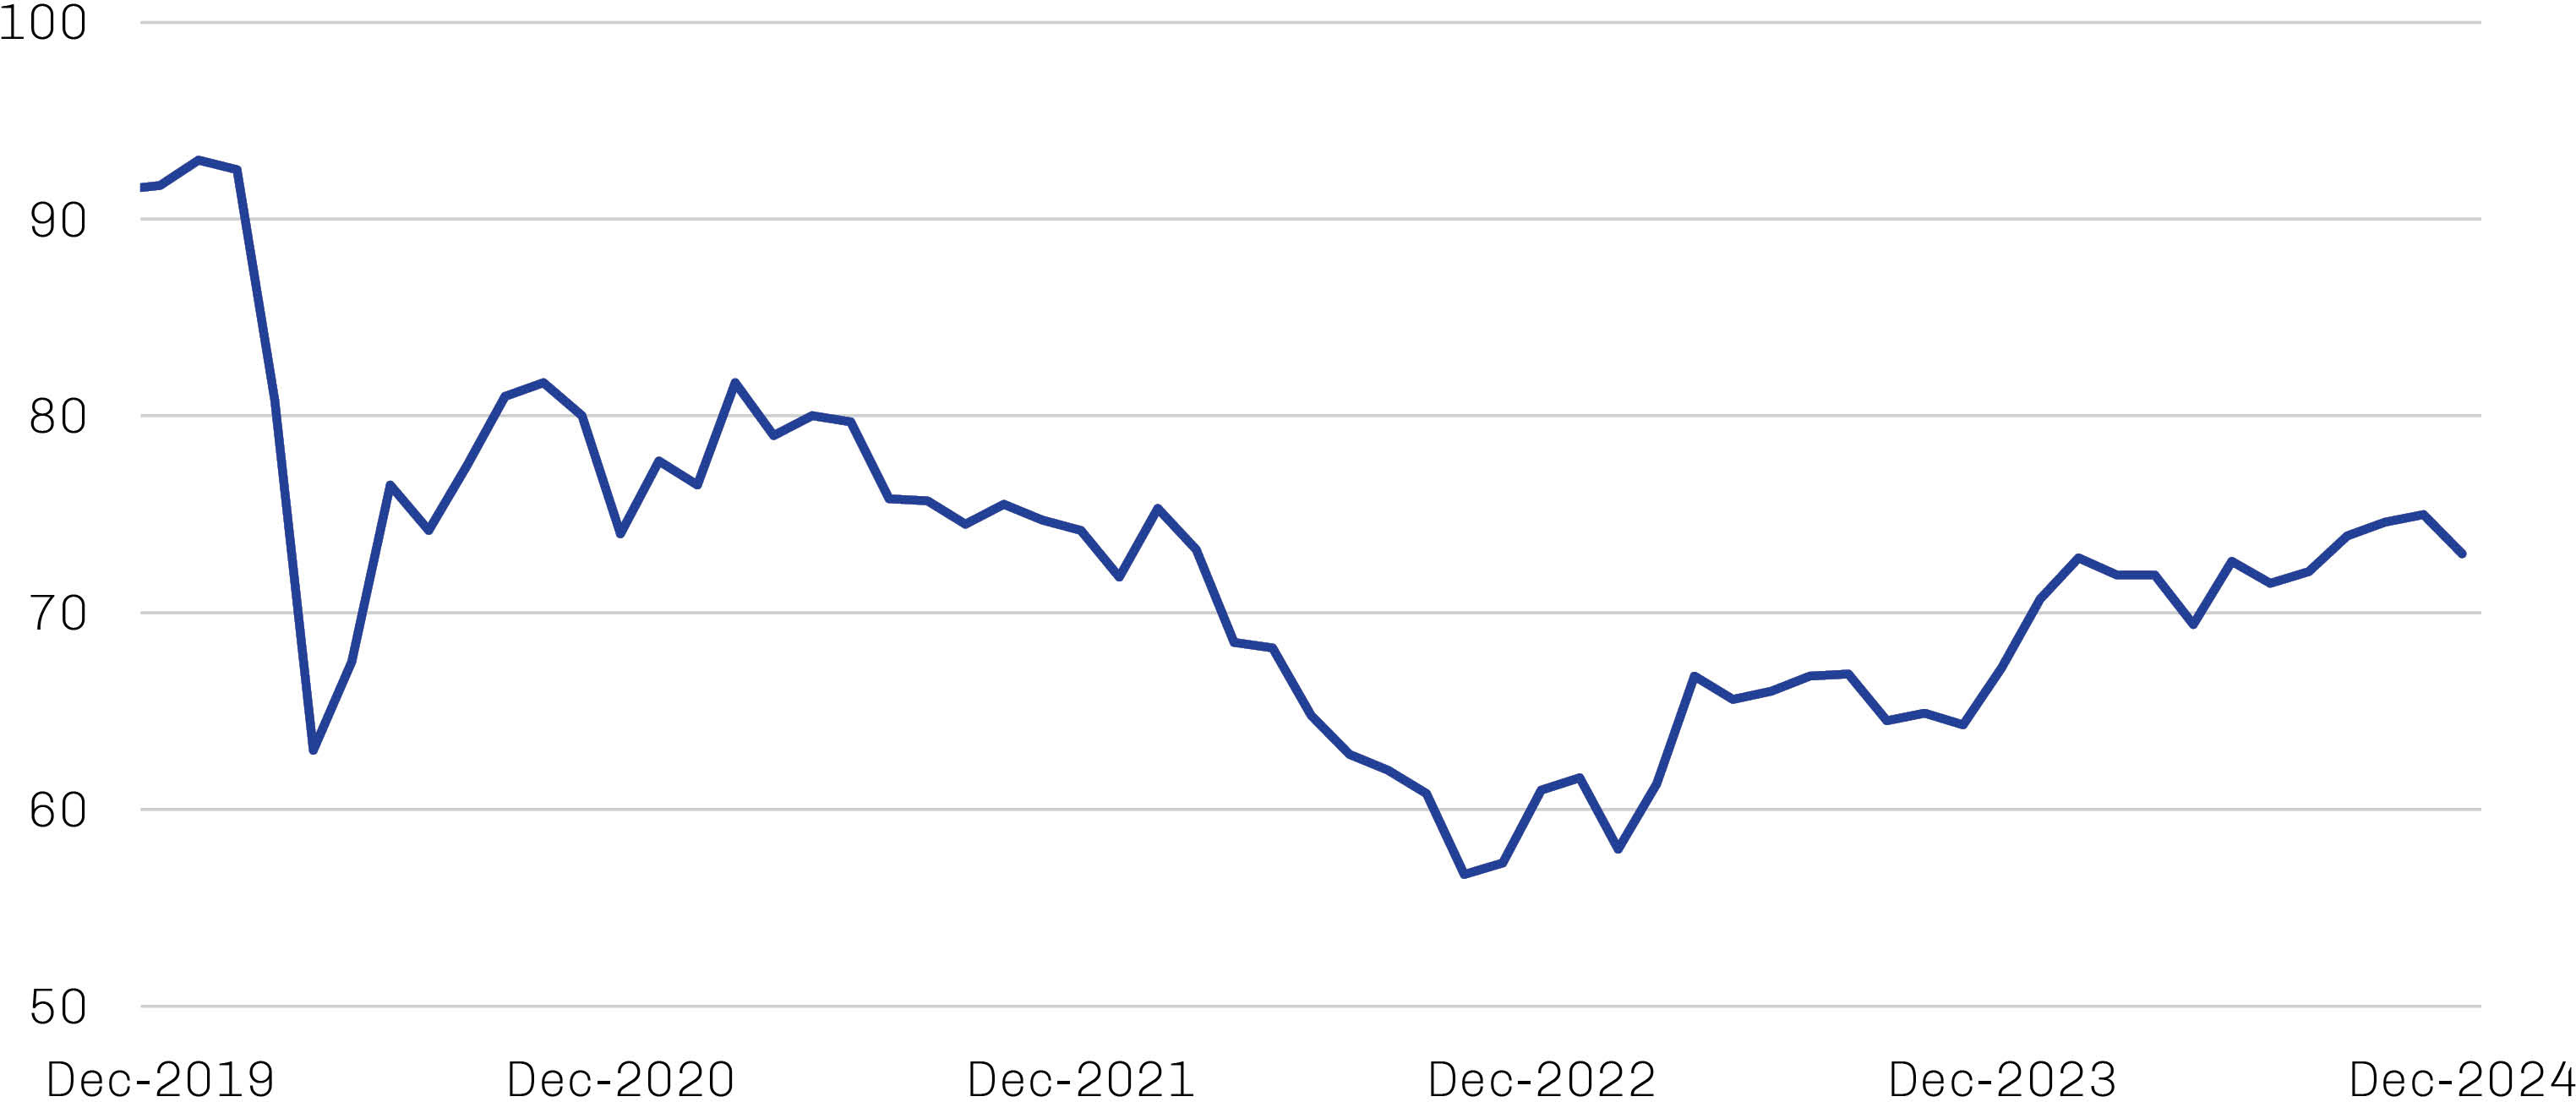
Source: Fannie Mae; data as of January 7, 2025.
Such acclimation may continue to be necessary. Mortgage rates have been on the rise since the Federal Reserve began cutting its policy rate in September, contrary to what many observers may have expected. This is because mortgage rates are based on long-term Treasury yields, which in turn are impacted by expectations for future short-term interest rates rather than their current levels. Due in large part to persistent inflation, expectations for future rates have been biased higher, pulling long Treasury and mortgage rates along with them.
But while improved affordability could drive additional demand, supply is likely to remain the US housing market’s main problem.
Credit Risk Premia in Public Markets Has Shrunk…
The strong performance of credit over the last 18 months has driven spreads for most public securities markets well below their long-term averages. This is particularly true of traditional public fixed income products, which enter 2025 facing the most severe valuation constraints seen in more than two decades, as shown in Exhibit 4.
Exhibit 4. Valuations Are Constrained Across Many Public Credit Segments
Spread Percentile Ranks, January 2010 through December 2024

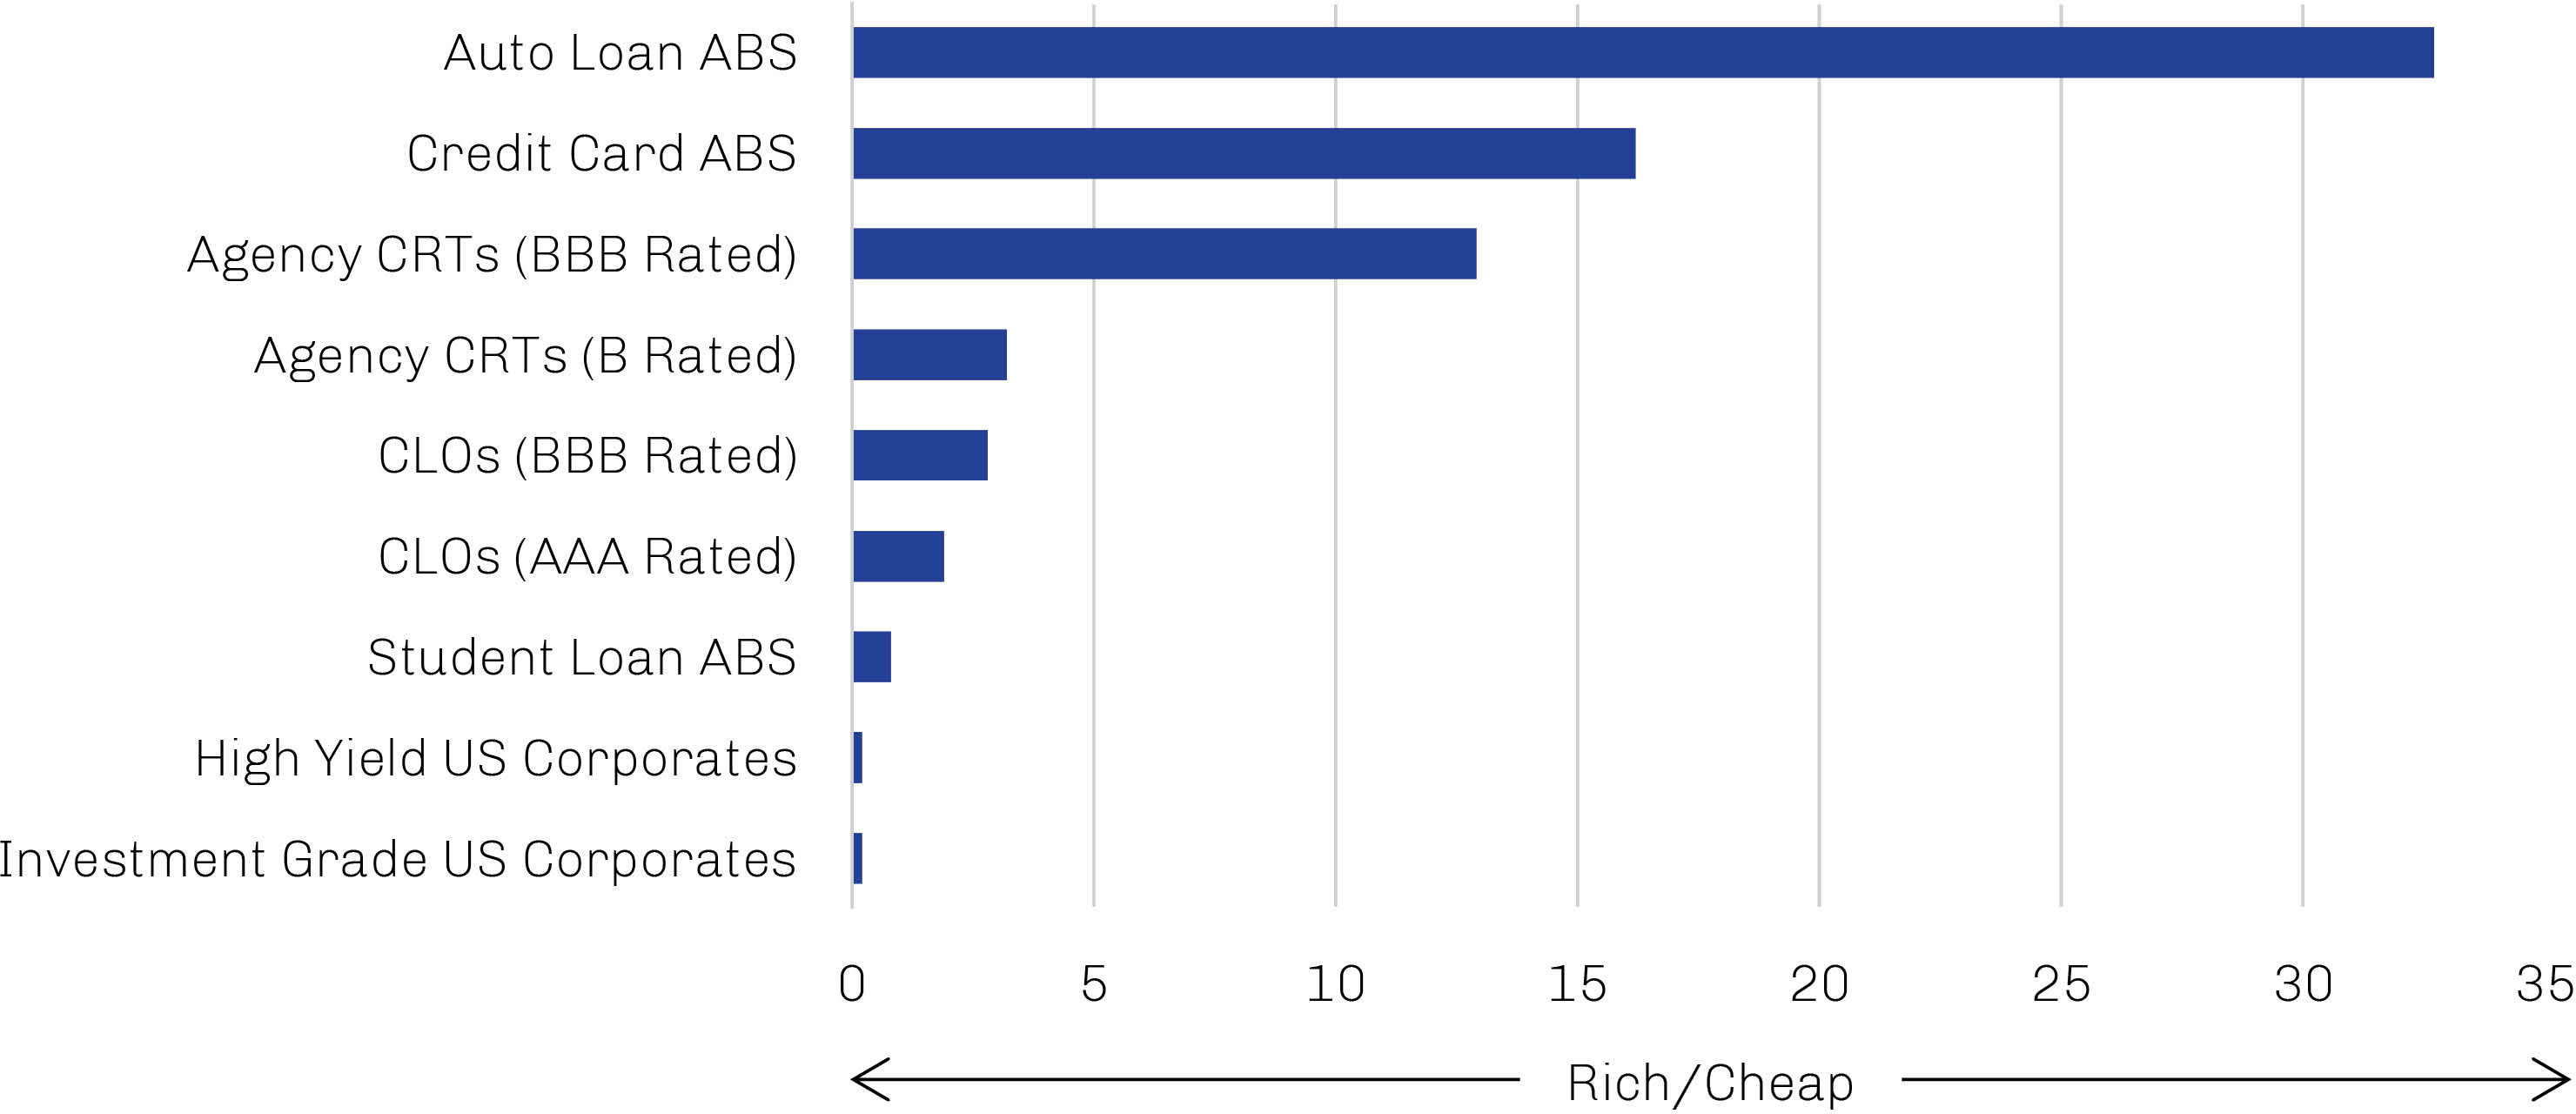
Note: Auto Loan ABS = ICE BofA AA-BBB US Fixed Rate Automobile ABS Index; Credit Card ABS = ICE BofA AA-BBB US Floating Rate Credit Card ABS Index; Agency CRTs (BBB Rated) and Agency CRTs (B Rated) = Goldman Sachs Global Investment Research calculations using outstanding prices; CLOs (BBB Rated) = Palmer Square CLO BBB Index; CLOs (AAA Rated) = Palmer Square CLO AAA Index; Student Loan ABS = ICE BofA AA-BBB US Floating Rate Student Loan ABS Index; High Yield US Corporates = Bloomberg US Corporate High Yield Index; Investment Grade US Corporates = Bloomberg US Corporate Index.
Source: PitchBook | LCD, Goldman Sachs Global Investment Research; data as of December 3, 2024.
There are a range of real estate-backed structured credit products that trade publicly. In addition to the spread pressures felt across the fixed income complex, many of these products have been further squeezed by the “technical” bid for absolute yield as well as the resilient macro backdrop for US residential real estate. Credit risk transfer (CRT) securities—non-guaranteed mortgage-backed securities issued by US government sponsored enterprises Fannie Mae and Freddie Mac—are one such example.
CRTs have been particularly successful of late. CRTs pay a fixed spread over 30-day SOFR (Secured Overnight Financing Rate), which is highly sensitive to changes in the federal funds rate and rose from near zero to well above 5% during the Fed’s 2022–23 hiking cycle.4 CRT spreads to SOFR widened significantly on concerns that central bank tightening would trigger a recession and an associated increase in mortgage delinquencies. As a result of higher rates and wider spreads, these securities offered very high yields despite containing attractive structural provisions; through the Covid-19 dislocation, for example, no CRT transaction experienced a loss greater than two basis points.5 With the US economy proving resilient despite tighter financial conditions, risk appetites soon returned and CRT spreads have tightened by about 1,000 basis points since late 2022, as shown in Exhibit 5. This tightening provided CRT investors with robust returns, but we believe the current entry point for these vehicles appears less attractive at current levels.
Exhibit 5. Credit Risk Transfer Spreads Have Tightened Meaningfully Over the Past Two Years
CRT B2 Spread to 30-Day SOFR in Basis Points, December 2020 through December 2024

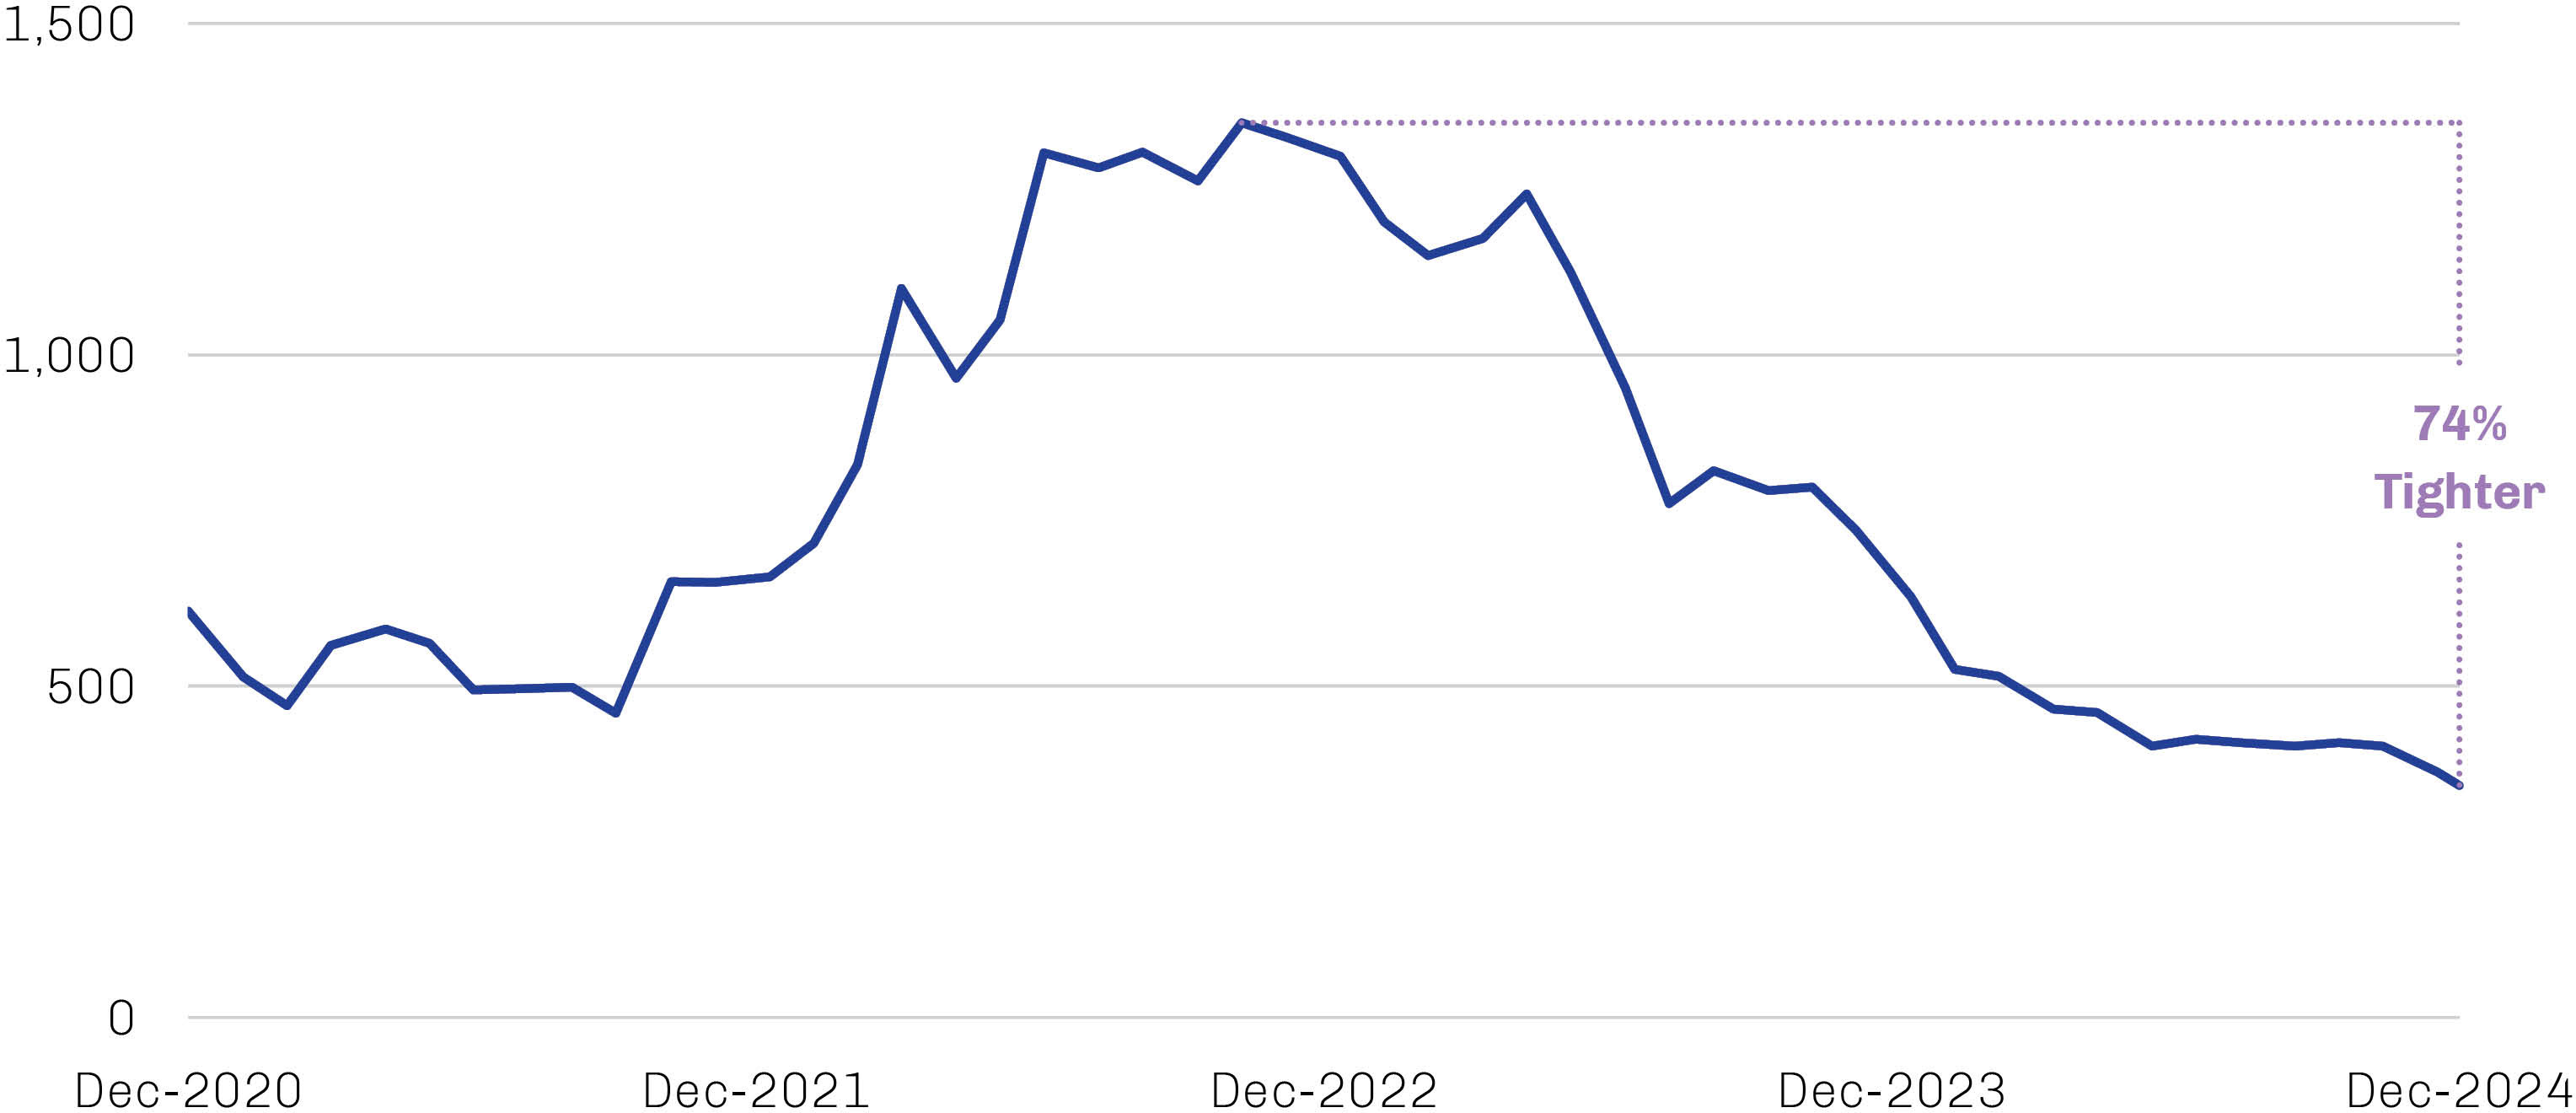
Source: Citi Research; data as of December 13, 2024.
…but We Believe Opportunities in Private Residential Real Estate Debt Remain Attractive
With public credit spreads near all-time tights entering 2025, the returns on residential mortgage securities like CRTs are likely to be more modest in the months ahead.6 At this time, we believe there are more attractive opportunities to be found on the private side of the real estate debt market, including residential transitional loans and land banking. Private markets tend to have a delayed and lagged response to changes in lending costs, and their structural complexity and illiquidity typically provide an additional boost to yields. Further, the short durations and robust cash flows typical of these assets enable the frequent reinvestment of proceeds, providing investors optionality to migrate into public credit opportunities should market conditions shift.
While high home prices and strong demand would seem to be powerful motivators for homebuilders to aggressively fill the housing gap, significant headwinds persist. Notably, rising construction costs have weighed on builders’ profit margins and put further upward pressure on home prices. Materials, equipment and labor costs are all up sharply post-Covid, and the price of land has outstripped the rise in housing prices nationally.7 The explicit and/or implicit costs of regulatory compliance in order to develop buildable lots—which include a range of requirements from zoning approval to permitting to environmental studies—have remained high as well; a study from 2021 found that regulations imposed by all levels of government account for nearly 24% of the final price of a new single-family home.8
Given high costs and lengthy timelines, homebuilders have long relied heavily on credit to finance new construction or the renovation of existing properties for resale. But commercial banks, their traditional source of funding, have pulled back from certain types of real estate activities—including acquisition, development and construction lending—due to regulatory changes enacted in the wake of the global financial crisis. As shown in Exhibit 6, construction loans as a percentage of bank total assets today are less than half of what they were in 2007.
Exhibit 6. Traditional Banks Have Pulled Back from Certain Types of Real Estate Lending
Construction Loans as a Percentage of Total Bank Assets, 2007 through 2024

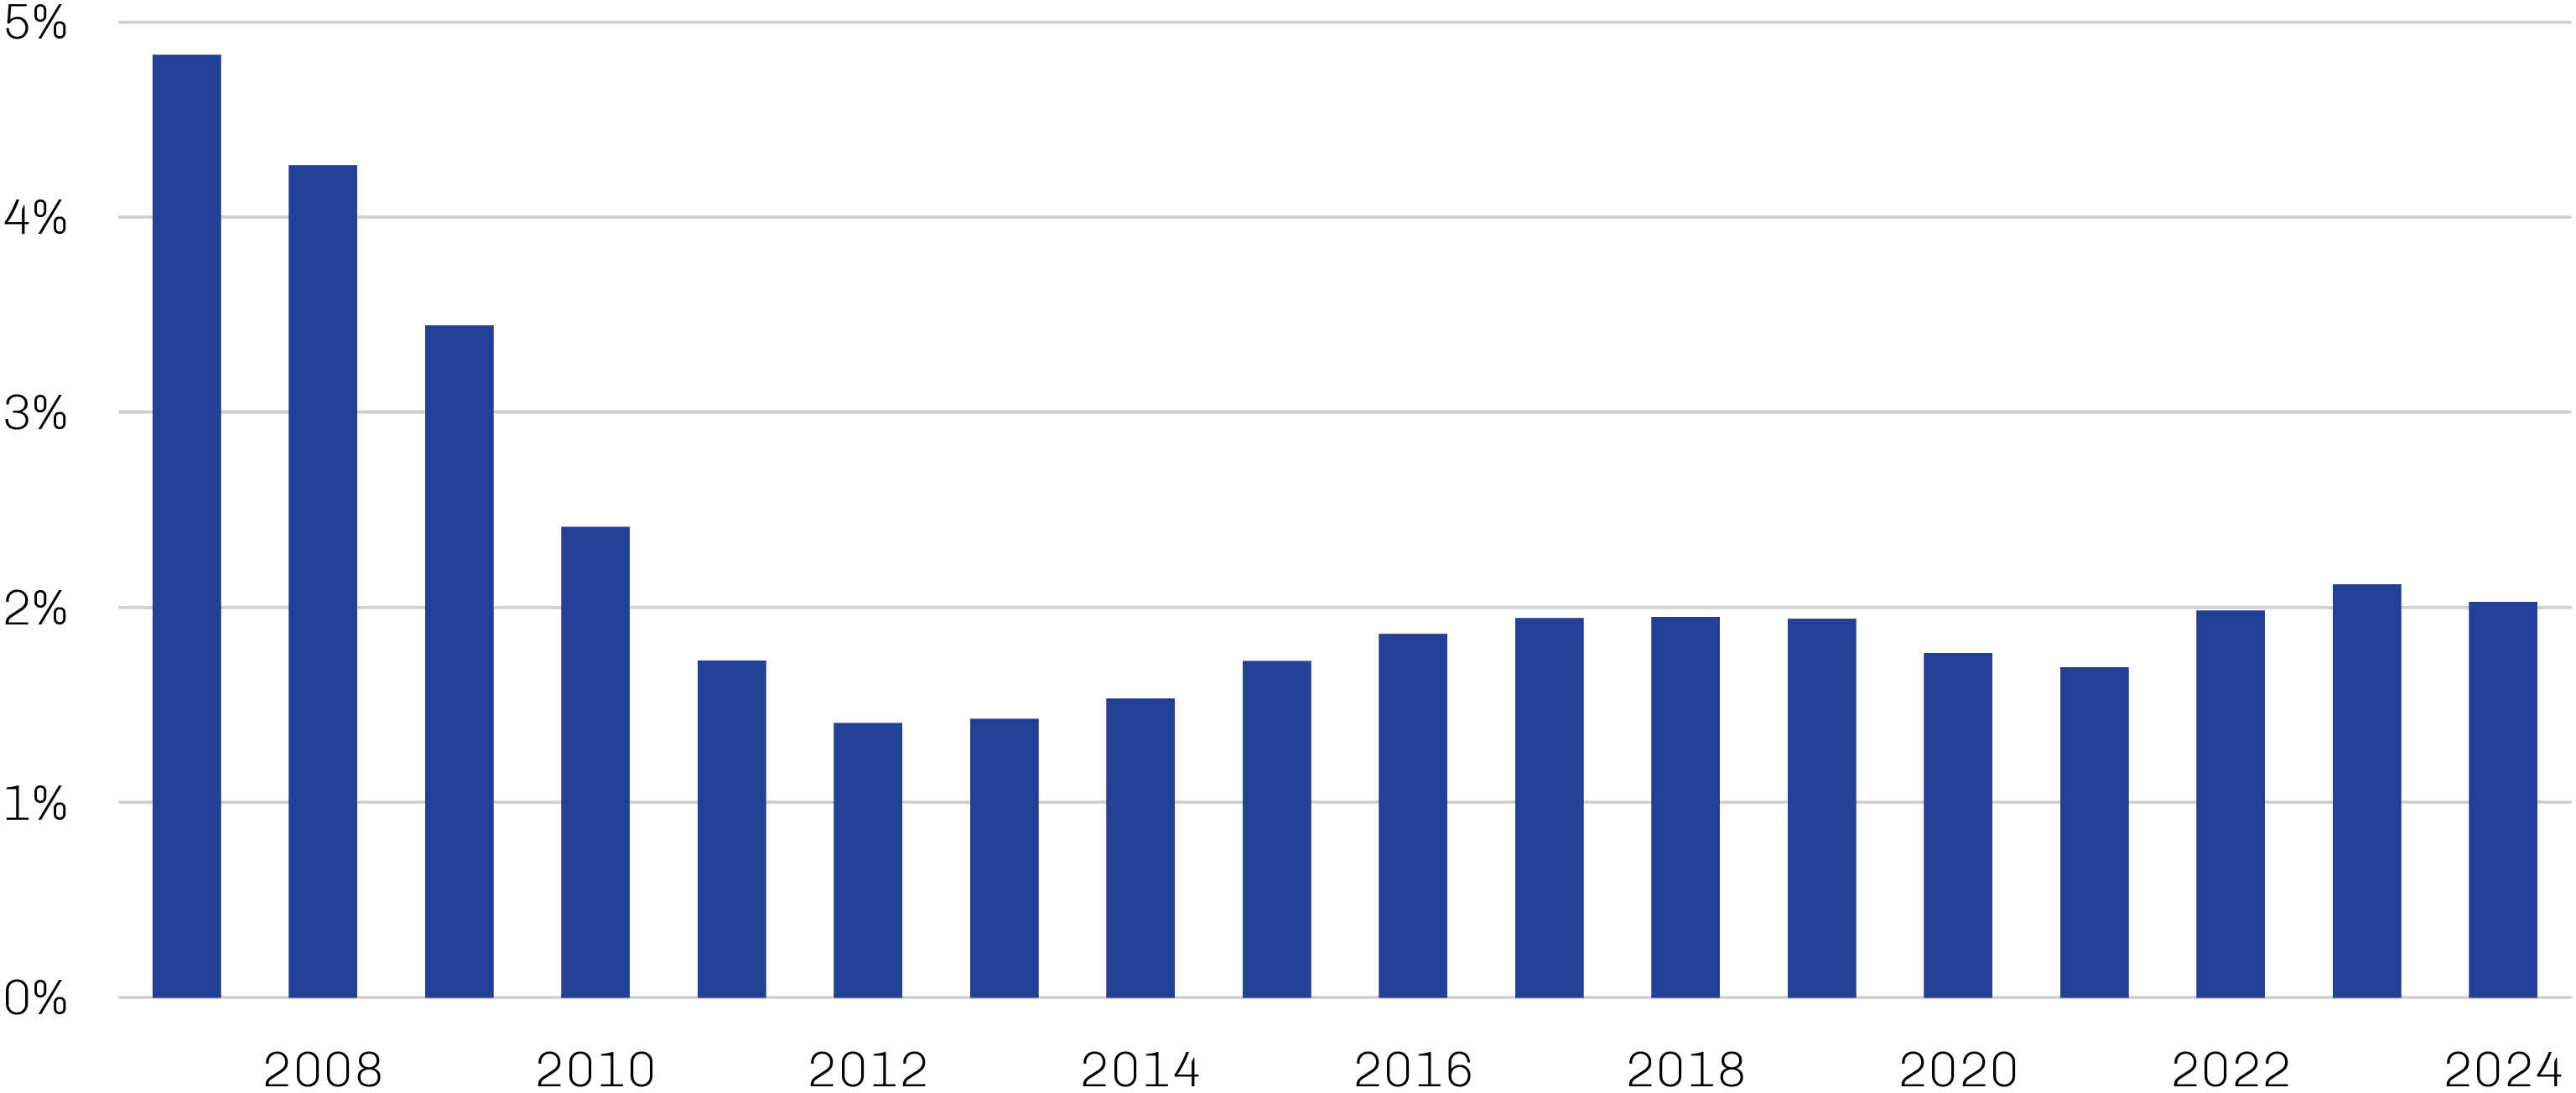
Source: Federal Deposit Insurance Corporation; data as of December 31, 2024.
As commercial bank activity has receded, a fragmented collection of specialty lenders have stepped in. The majority of these lenders lack the capital to underwrite and hold these loans at meaningful scale, however, which has presented an opportunity for asset managers to provide necessary liquidity to the real estate industry at attractive terms.
Residential transitional loans are an example of one such opportunity. To many buyers, a refurbished home in an established neighborhood with proven infrastructure like schools, parks and retail is more desirable than a new home in a new area. As could be inferred from the aged state of the US housing stock depicted in Exhibit 7, not every legacy property is in turnkey condition, which has fueled the proliferation of “fix and flip” activity. Real estate developers purchase single family residences with the intent of renovating and reselling them at a profit within a short period of time. There is a similar dynamic evident in the multifamily space, as existing rental properties are upgraded to standards that can command higher rents.
Exhibit 7. Aged US Housing Stock Fuels Demand for Renovation Capital
Estimates of Median Age in Years of US Owner-Occupied Housing, 2005 through 2022
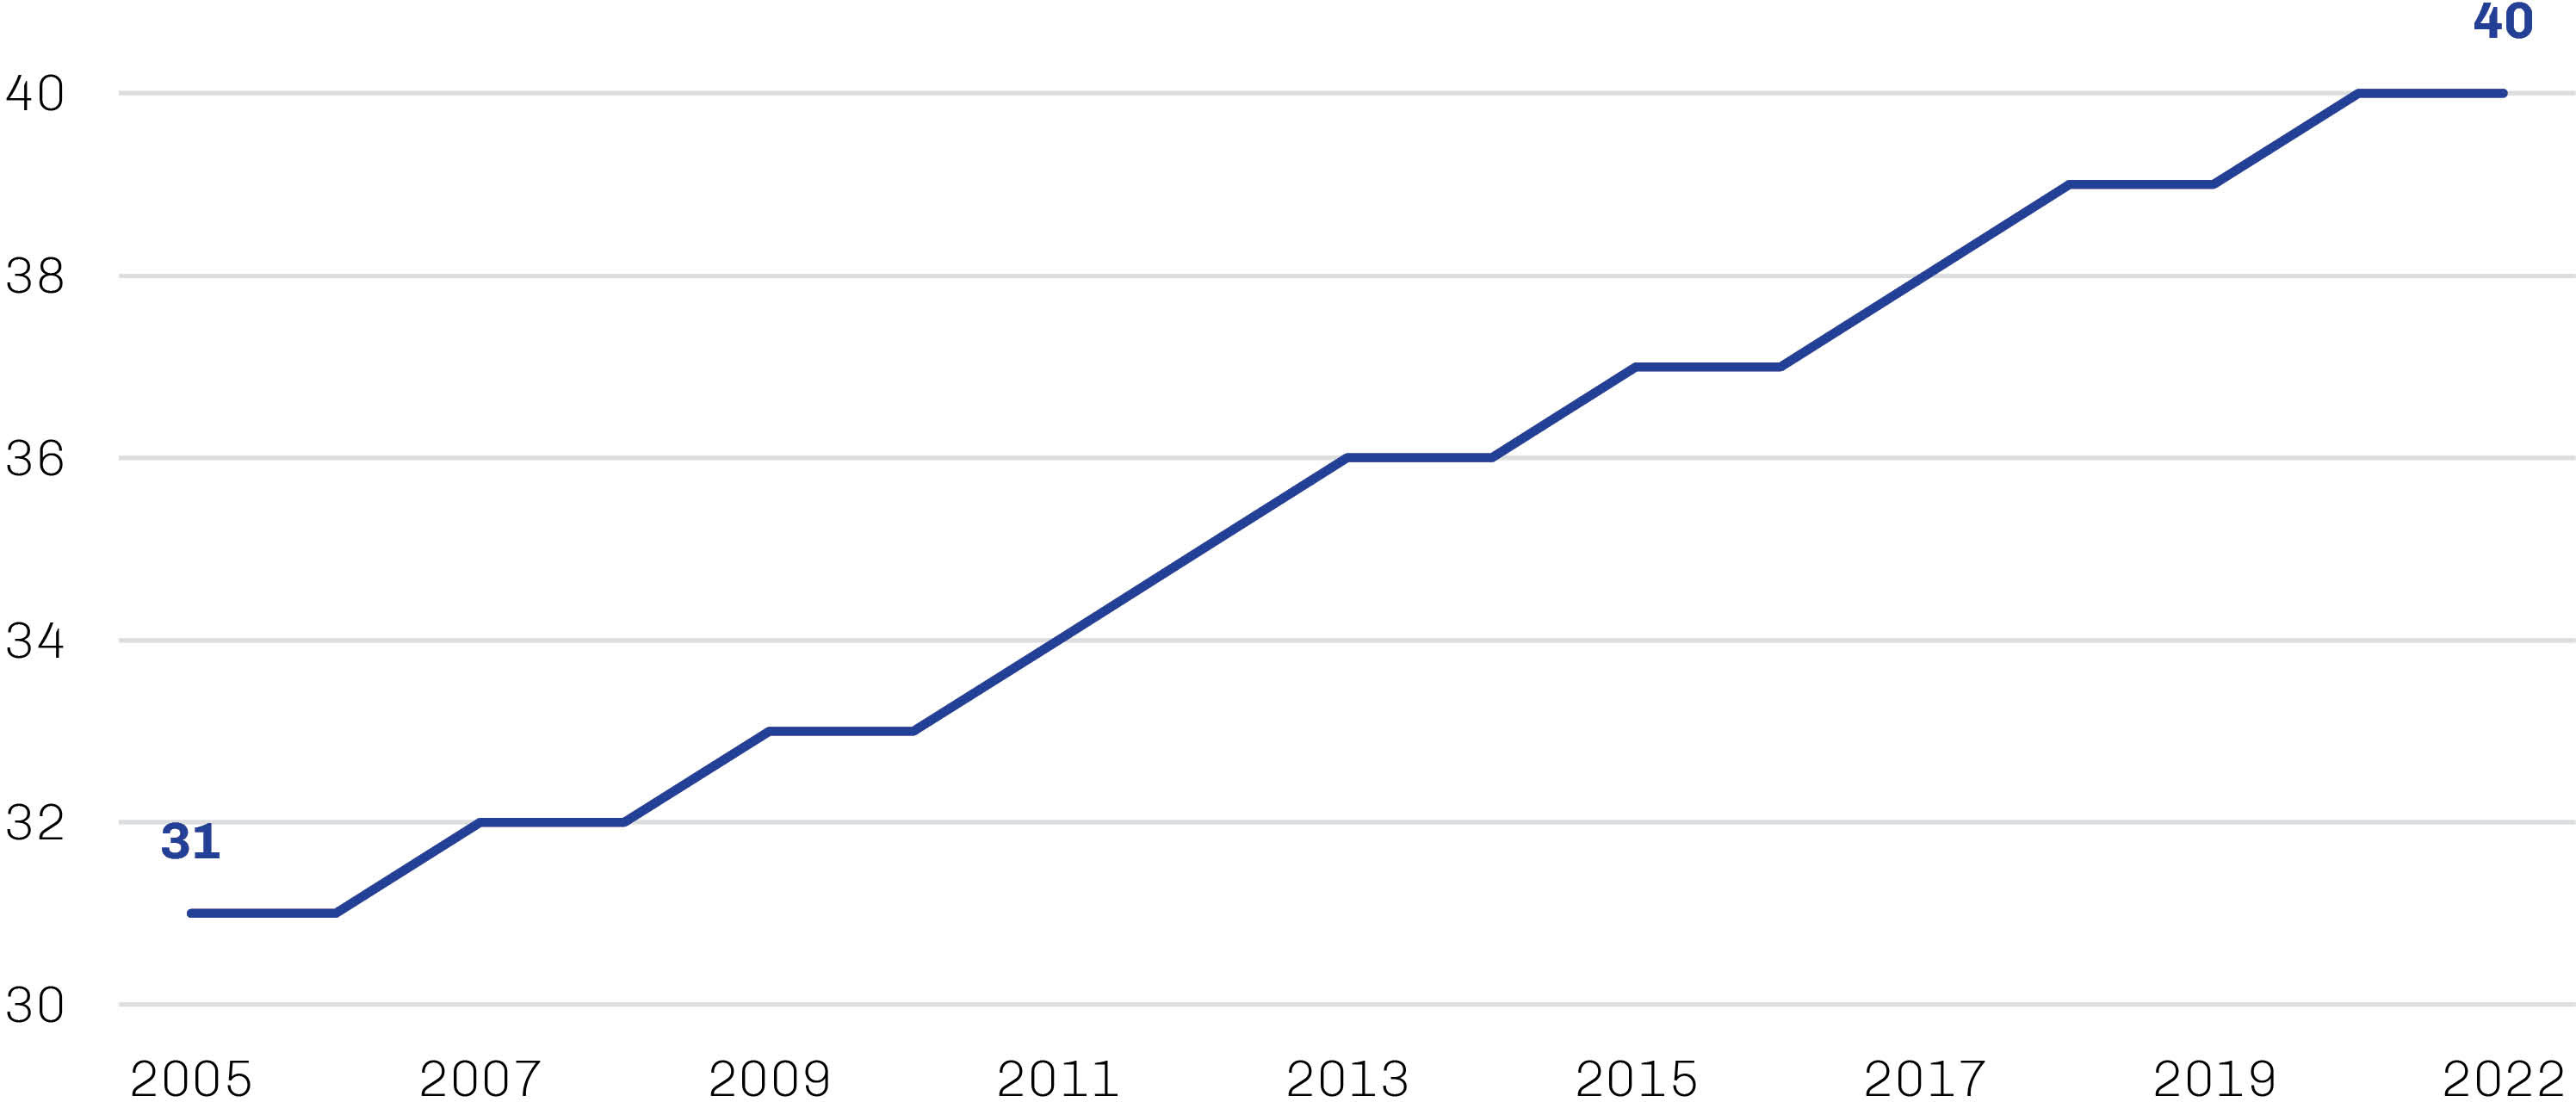
Note: The Census Bureau did not release the standard American Community Survey in 2020 due to data-collection disruptions experienced during the Covid-19 pandemic.
Source: US Census Bureau, American Community Survey; data as of December 31, 2022. Reflects latest data available.
Residential transitional loans provide the capital for these rehabs. These loans are typically 12 to 18 months in tenor and secured by a first lien on the property, with interest-only payments until the principal is due at maturity. Frequently, these loans are originated by small, regional private lenders focused exclusively on this type of financing and related services. Lacking the scale to hold these loans to maturity, originators often sell them to large, nonbank asset managers looking to build diversified portfolios of residential transitional loans they believe will generate compelling risk-adjusted long-term returns.
Land banking is another area where we see opportunity. The limited supply of buildable land is among the factors constraining the rebound in US new-home construction, a fact often overlooked in a country with a land area in excess of 3.5 million square miles.9 Beyond the limitations of local zoning laws, the process of preparing raw land for construction—from design to infrastructure build—often takes two years or more as a result of significant local, state and national regulations.10
This lag can be a challenge for homebuilders trying to maintain robust development pipelines without compromising liquidity and financial flexibility, and many have moved toward “land-light” business models in response. As such, off-balance-sheet financing solutions like land banking—in which a capital provider, in exchange for a fee, acquires and holds property on behalf of a builder that has agreed to purchase lots on the property at a predetermined schedule—have become a staple of builders’ land inventory-management strategies. Large public homebuilders, in particular, have demonstrated a willingness to pay a significant premium to the prevailing interest rate on corporate debt for the benefits of such an arrangement.
Staying Nimble Within a Secular Growth Story
While dynamics remain supportive of the US housing market as a whole, we believe current return prospects favor private lending opportunities. However, history has shown that public markets can quickly grow volatile, especially in an environment of tight credit spreads; it would not be surprising to see spreads widen significantly should some sort of near-term dislocation occur. We believe investors able to nimbly adjust their public and private exposures and seize upon unique opportunities as they emerge may be well positioned for success in the residential real estate debt space.
1. Source: Freddie Mac, National Mortgage Database; data as of December 31, 2024.
2. Source: Freddie Mac; data as of December 19, 2024.
3. Source: Federal Reserve Board of St. Louis; data as of September 30, 2024.
4. Source: Federal Reserve Bank of St. Louis; data as of August 31, 2024.
5. Source: Fannie Mae, Freddie Mac and Napier Park; data as of December 31, 2024.
6. Source: ICE Data Indices; data as of January 9, 2025.
7. Source: Federal Housing Finance Agency; data as of August 6, 2024.
8. Source: National Association of Home Builders; data as of May 5, 2021.
9. Source: US Census Bureau; data as of December 31, 2024.
10. Source: National Association of Home Builders; data as of May 5, 2021.
The opinions expressed are not necessarily those of the firm. These materials are provided for informational purposes only. These opinions are not intended to be a forecast of future events, a guarantee of future results, or investment advice. Any statistics contained herein have been obtained from sources believed to be reliable, but the accuracy of this information cannot be guaranteed. The views expressed herein may change at any time subsequent to the date of issue hereof. The information provided is not to be construed as a recommendation to buy, hold or sell or the solicitation or an offer to buy or sell any fund or security.
Past performance is not indicative of future results.
Risk Disclosures
All investments involve the risk of loss of principal.
There are risks associated with investing in securities of foreign countries, such as erratic market conditions, economic and political instability and fluctuations in currency exchange rates.
A principal risk of investing in value stocks is that the price of the security may not approach its anticipated value or may decline in value. “Value” investments as a category, or entire industries or sectors associated with such investments, may lose favor with investors as compared to those that are more “growth” oriented.
The value and liquidity of portfolio holdings may fluctuate in response to events specific to the companies or markets, as well as economic, political or social events in the US or abroad. During periods of market volatility, the value of individual securities and other investments at times may decline significantly and rapidly. The securities of small and micro-size companies can be more volatile in price than those of larger companies and may be more difficult or expensive to trade.
There are risks associated with investing in foreign investments (including depositary receipts). Foreign investments, which can be denominated in foreign currencies, are susceptible to less politically, economically and socially stable environments; fluctuations in the value of foreign currency and exchange rates; and adverse changes to government regulations.
Investment in gold and gold-related investments present certain risks, including political and economic risks affecting the price of gold and other precious metals, like changes in US or foreign tax, currency or mining laws; increased environmental costs; international monetary and political policies; economic conditions within an individual country; trade imbalances; and trade or currency restrictions between countries. The price of gold, in turn, is likely to affect the market prices of securities of companies mining or processing gold and, accordingly, the value of investments in such securities may also be affected. Gold-related investments as a group have not performed as well as the stock market in general during periods when the US dollar is strong, inflation is low and general economic conditions are stable. In addition, returns on gold-related investments have traditionally been more volatile than investments in broader equity or debt markets. Investment in gold and gold-related investments may be speculative and may be subject to greater price volatility than investments in other assets and types of companies.
Municipal bonds are subject to credit risk, interest rate risk, liquidity risk and call risk. However, the obligations of some municipal issuers may not be enforceable through the exercise of traditional creditors’ rights. The reorganization under federal bankruptcy laws of a municipal bond issuer may result in the bonds being cancelled without payment or repaid only in part or in delays in collecting principal and interest.
The information is not intended to provide and should not be relied on for accounting or tax advice. Any tax information presented is not intended to constitute an analysis of all tax considerations.
Diversification does not guarantee investment returns and does not eliminate the risk of loss.
Alternative Investment Risks
Alternative investments can be speculative and are not suitable for all investors. Investing in alternative investments is only intended for experienced and sophisticated investors who are willing and able to bear the high economic risks associated with such an investment. Investors should carefully review and consider potential risks before investing. Certain of these risks include:
• Loss of all or a substantial portion of the investment;
• Lack of liquidity in that there may be no secondary market or interest in the strategy and none is expected to develop;
• Volatility of returns;
• Interest rate risk;
• Restrictions on transferring interests in a private investment strategy;
• Potential lack of diversification and resulting higher risk due to concentration within one or more sectors, industries, countries or regions;
• Absence of information regarding valuations and pricing;
• Complex tax structures and delays in tax reporting;
• Less regulation and higher fees than mutual funds;
• Use of leverage, which magnifies the potential for gain or loss on amounts invested and is generally considered a speculative investment technique and increases the risks associated with investing in the strategy;
• Carried interest, which may cause the strategy to make more speculative, higher-risk investments than would be the case in absence of such arrangements; and
• Below investment grade loans, which may default and adversely affect returns.
Indexes are unmanaged and one cannot invest directly in an index.
Bloomberg Municipal Bond Index (Gross/Total) measures the performance of the US municipal tax-exempt investment grade bond market. A total-return index tracks price changes and reinvestment of distribution income.
Bloomberg US Aggregate Bond Index (Gross/Total) measures the performance of the investment grade, US dollar-denominated, fixed-rate taxable bond market in the US, including Treasuries, government-related and corporate securities, fixed-rate agency MBS (agency fixed-rate and hybrid ARM passthroughs), ABS and CMBS. A total-return index tracks price changes and reinvestment of distribution income.
Bloomberg US Corporate Bond Index (Gross/Total) measures the performance of investment grade, fixed-rate, taxable corporate bond market. It includes US dollar denominated securities publicly issued by US and non-US industrial, utility and financial issuers. A total-return index tracks price changes and reinvestment of distribution income.
Bloomberg US Corporate High Yield Bond Index (Gross/Total) measures the US dollar-denominated, high yield, fixed-rate corporate bond market. Securities are classified as high yield if the middle rating of Moody’s, Fitch and S&P is Ba1/BB+/BB+ or below. A total-return index tracks price changes and reinvestment of distribution income.
Cliffwater Direct Lending Index is an asset-weighted index of US middle market direct loans.
Consumer price index (CPI) (Price) measures inflation as experienced by consumers in their day-to-day living expenses by capturing the average change over time in the prices paid for a representative basket of consumer goods and services. A price-return index only measures price changes.
Fannie Mae Home Purchase Sentiment Index (HPSI) (Gross/Total) distills consumer responses to Fannie Mae’s monthly National Housing Survey into a single indicator designed to provide signals on future housing outcomes. A total-return index tracks price changes and reinvestment of distribution income.
ICE BofA AA-BBB US Fixed Rate Automobile ABS Index (Gross/Total) measures the performance of asset-backed securities collateralized by automobile loans with a middle rating in a range of AA/Aa to BBB/Baa as measured Moody’s, Fitch and S&P. A total-return index tracks price changes and reinvestment of distribution income.
ICE BofA AA-BBB US Floating Rate Credit Card ABS Index (Gross/Total) measures the performance of asset-backed securities collateralized by credit card loans with a middle rating in a range of AA/Aa to BBB/Baa as measured Moody’s, Fitch and S&P. A total-return index tracks price changes and reinvestment of distribution income.
ICE BofA AA-BBB US Floating Rate Student Loan ABS Index (Gross/Total) measures the performance of asset-backed securities collateralized by student loans with a middle rating in a range of AA/Aa to BBB/Baa as measured Moody’s, Fitch and S&P. A total-return index tracks price changes and reinvestment of distribution income.
ICE BofA Current 10-Year US Treasury Index measures the performance of US Treasury securities with a remaining maturity exceeding seven years and less than or equal to 10 years. A total-return index tracks price changes and reinvestment of distribution income.
Morningstar LSTA US Leveraged Loan Index (Gross/Total) is a market value-weighted index that measures the performance of the US leveraged loan market. A total-return index tracks price changes and reinvestment of distribution income.
MSCI China Index (Net) measures the performance of large and midcap representation across China A shares, H shares, B shares, Red chips, P chips and foreign listings. A net-return index tracks price changes and reinvestment of distribution income net of withholding taxes.
MSCI World Index (Net) measures the performance of large and midcap equities across developed markets. A net-return index tracks price changes and reinvestment of distribution income net of withholding taxes.
Palmer Square CLO AAA Index (Gross/Total) is a subindex of the Palmer Square CLO Debt Index that tracks only CLOs originally rated AAA. A total-return index tracks price changes and reinvestment of distribution income.
Palmer Square CLO BBB Index (Gross/Total) is a subindex of the Palmer Square CLO Debt Index that tracks only CLOs originally rated BBB. A total-return index tracks price changes and reinvestment of distribution income.
Russell 2000® Index (Gross/Total) measures the performance of the small cap segment of the US equity universe. It includes approximately 2,000 of the smallest securities based on a combination of their market cap and current index membership. A total-return index tracks price changes and reinvestment of distribution income.
S&P 500 Index (Gross/Total) measures the performance of 500 of the top companies in the leading industries of the US economy and is widely recognized as a proxy for the US market as a whole. A total-return index tracks price changes and reinvestment of distribution income.
S&P Municipal Bond High Yield Index (Gross/Total) measures the performance of bonds in the S&P Municipal Bond Index that are not rated or whose ratings are below investment grade. A total-return index tracks price changes and reinvestment of distribution income.
S&P Municipal Yield Index (Gross/Total) measures the performance of high yield and investment grade municipal bonds. A total-return index tracks price changes and reinvestment of distribution income.
Definitions
A 10-year Treasury note is a debt obligation of the US government with a maturity of 10 years upon issuance.
AA credit rating—as used by S&P Global Ratings and Fitch Ratings—is an investment grade rating on a bond considered to have a very strong capacity to meet its financial commitments. The equivalent rating from Moody’s Investors Service is Aa.
AAA credit rating—as used by S&P Global Ratings and Fitch Ratings—is an investment grade rating on a bond considered to have an extremely strong capacity to meet its financial commitments. The equivalent rating from Moody’s Investors Service is Aaa.
Asset-based lending (ABL) is corporate borrowing supported by specific assets of the borrower rather than its cash flows.
BBB credit rating—as used by S&P Global Ratings and Fitch Ratings—is an investment grade rating on a bond considered to have adequate capacity to meet its financial commitments but that is more susceptible to adverse business, financial and economic conditions. The equivalent rating from Moody’s Investors Service is Baa.
Beta is a measure of an investment’s price volatility relative to that of the overall market.
A bull market is generally defined as a period during which a securities market index rises by 20% or more.
A business development company is a closed-end investment vehicle that invests in early stage and/or distressed small and medium- sized companies.
Collateralized loan obligations (CLO) are financial instruments collateralized by a pool of corporate loans.
Collective investment funds (CIFs), also known as collective investment trusts (CITs), are bank-administered trusts that hold commingled assets.
A credit rating is an assessment provided by a nationally recognized statistical rating organization (NRSRO) of the creditworthiness of an issuer with respect to debt obligations, including specific securities, money market instruments or other bonds. Ratings are measured on a scale that generally ranges from AAA/Aaa (highest) to D/RD (lowest); ratings are subject to change without notice. Not rated (NR) indicates that the debtor was not rated and should not be interpreted as indicating low quality.
Credit-risk transfer (CRT) securities are synthetic securitizations that reference the credit risk of a designated group of mortgage loans guaranteed by Fannie Mae or Freddie Mac.
Currency debasement refers to the reduction of a currency’s purchasing power.
Direct lending refers to a loan agreement between a borrower and single lender or small group of lenders. Direct lending can also be referred to as “private credit” or “private lending.”
Exchange-traded funds (ETFs) are listed investment vehicles that seek to provide exposure to a benchmark, index or actively managed strategy.
Federal funds rate is the interest rate at which depository institutions (banks and credit unions) lend reserve balances to other depository institutions overnight on an uncollateralized basis.
General obligation bonds are municipal securities in which payments are backed by the full faith and credit of the issuer and by extension its ability to tax its residents.
A Goldilocks economic scenario refers to a level of growth that is neither strong enough to promote inflation pressures nor weak enough to suggest recession may be near.
Government-sponsored enterprises (GSEs) were established and chartered by the US federal government for public policy purposes. They are private companies, and their securities are not backed by the full faith and credit of the federal government.
High yield municipal bonds are debt securities issued by states, cities, counties and other public entities that offer a higher rate of interest due to their perceived higher risk of default.
An interval fund is a pooled investment vehicle that offers investors periodic liquidity at an interval specified in its prospectus.
Moody’s Investors Service is a nationally recognized statistical rating organization (NRSRO) of the creditworthiness of an issuer with respect to debt obligations, including specific securities, money market instruments or other bonds. Ratings are measured on a scale that generally ranges from Aaa (highest) to RD (lowest); ratings are subject to change without notice.
Mortgage-backed securities (MBS) are debt securities whose payments of principal and interest are backed by the cash flow generated by pools of mortgage loans.
Net orderly liquidation value (NOLV) is the estimated proceeds from selling a borrower’s collateral assets in an orderly manner, including a reasonable amount of time to find a buyer, after all costs related to the sale.
Not rated (NR) indicates that the debtor was not rated and should not be interpreted as indicating low quality.
A private fund is a pooled investment vehicle that is not required to be registered or regulated as an investment company under the Investment Company Act of 1940, as amended.
Revenue bonds are municipal securities whose payments are backed not by a government’s taxing power but by revenues from a specific project or source, such as highway tolls or lease fees.
Secured Overnight Financing Rate (SOFR) is a broad measure of the cost of borrowing cash overnight collateralized by Treasury securities.
A separately managed account (SMA) is a portfolio of securities that is managed by a professional investment firm.
A soft landing refers to a gradual economic slowdown that comes to an end without triggering a recession.
Sovereign debt refers to debt obligations issued by a country’s government as a means to borrow capital.
S&P Global Ratings is a nationally recognized statistical rating organization (NRSRO) of the creditworthiness of an issuer with respect to debt obligations, including specific securities, money market instruments, or other bonds. Ratings are measured on a scale that generally ranges from AAA (highest) to D (lowest); ratings are subject to change without notice.
A tranche is a portion of a security issue with its own unique risk/reward characteristics and credit rating.
Undertakings for Collective Investment in Transferable Securities (UCITs) are pooled investment vehicles registered in countries in the European Union.
Volatility represents the degree to which an investment’s price has deviated from its average over time.
A yield curve is a graphical representation of interest rates on debt of equal credit quality across a range of maturities.
FEF Distributors, LLC (“FEFD”) (SIPC), a limited purpose broker-dealer, distributes certain First Eagle products. FEFD does not provide services to any investor, but rather provides services to its First Eagle affiliates. As such, when FEFD presents a fund, strategy or other product to a prospective investor, FEFD and its representatives do not determine whether an investment in the fund, strategy or other product is in the best interests of, or is otherwise beneficial or suitable for, the investor. No statement by FEFD should be construed as a recommendation. Investors should exercise their own judgment and/or consult with a financial professional to determine whether it is advisable for the investor to invest in any First Eagle fund, strategy, or product.
First Eagle Investments is the brand name for First Eagle Investment Management, LLC and its subsidiary investment advisers.
©2025 First Eagle Investment Management, LLC. All rights reserved.