


Macro & Market Views
Breaking Ground in Search of Hidden Gems
Breaking Ground in Search of Hidden Gems
Reflections 2024-2025
After two years of declining net issuance and heavy investor outflows, the municipal bond market began to recover on both fronts in 2024. While the favorable tailwinds that emerged last year may continue in 2025 to support the market broadly, John Miller, head and chief investment officer of the High Yield Municipal Credit team, walks a differentiated path. As he discusses, this includes directing the team’s underwriting knowledge toward the large, diverse cohort of nonrated municipal bonds.
Supportive Muni Dynamics May Continue
As the Federal Reserve steadily raised its policy rate across 2022 and 2023 in the face of decades-high inflation, many state and local municipalities—their coffers generally well stocked thanks to Covid-era federal stimulus and a large post-Covid rebound in tax revenue—curtailed bond issuance in what was a volatile interest rate environment. As shown in Exhibit 1, annual issuance of new muni bonds during the two years of the rate-hike cycle was off about 20% from previous levels. With the Fed on hold and ultimately moving to cut rates in 2024, tax-exempt issuance bounced back to a record high last year, and we believe a healthy level of supply is likely to persist as the benefit of federal support wanes and interest rates continue to moderate.
Exhibit 1. With Interest Rates off Their Peaks, Muni Bond Issuance Recovered in 2024
Annual Municipal Bond Issuance in Billions of Dollars, 2013 through 2024
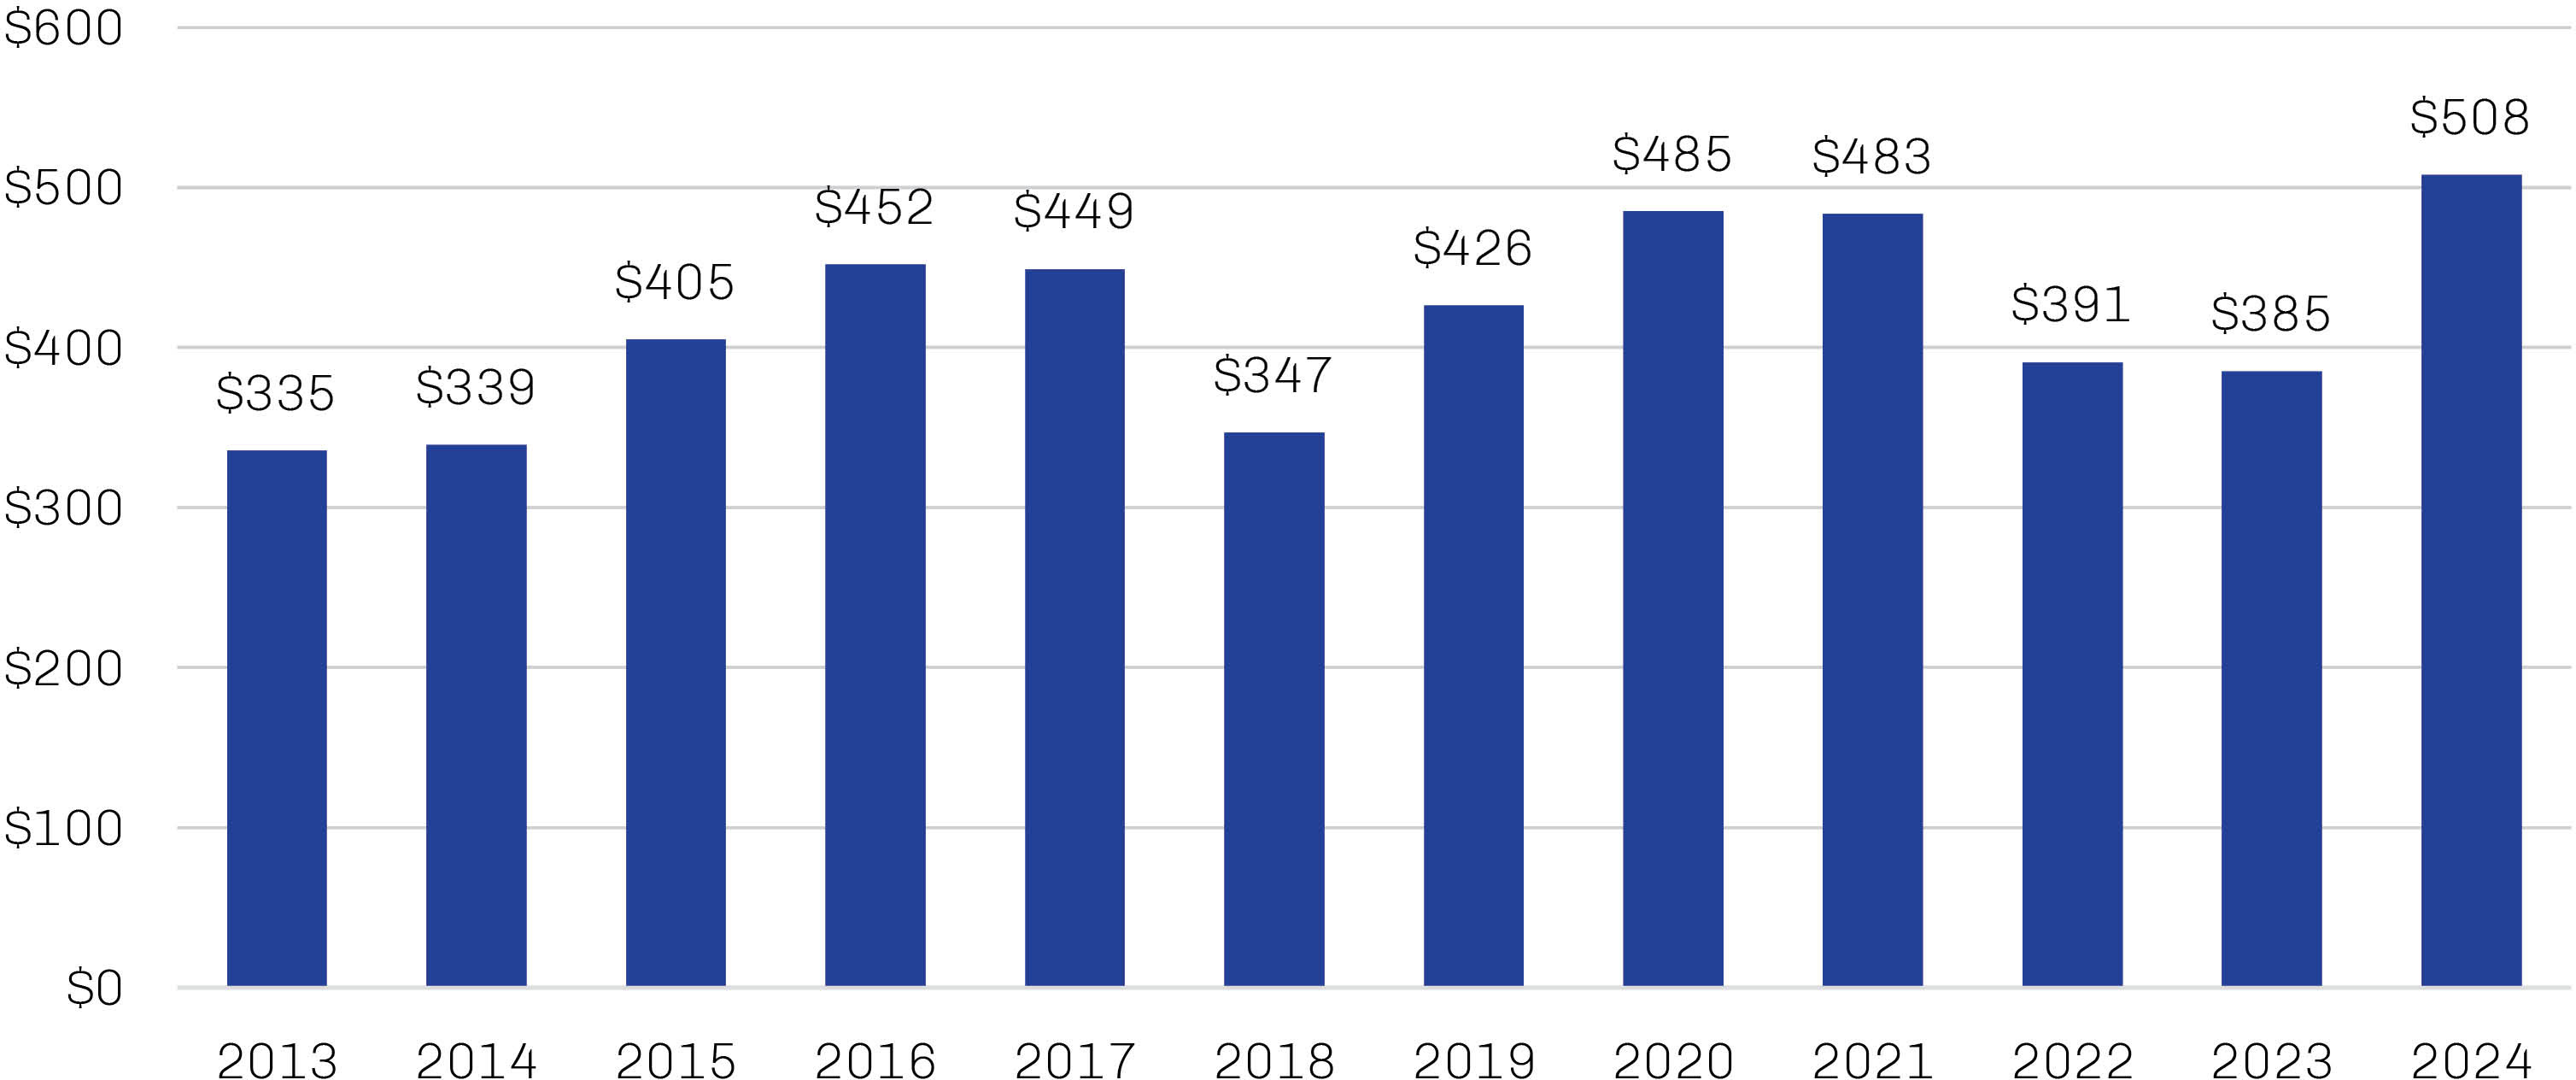
Source: Securities Industry and Financial Markets Association; data as of January 2, 2025.
Fed tightening also weighed on the demand side of the muni bond market, as higher yields on cash equivalents like money market funds lured investors away from other, riskier fixed income assets.1 Investors began to move back into muni mutual funds and ETFs in 2024, but inflows to date remain far from recouping all of the outflows from 2022 and 2023.2 In our view, the potential for lower interest rates in 2025 may provide durable support for inflows and help absorb renewed muni issuance.
Meanwhile, the fiscal positions of municipalities—unlike that of the US federal government—continue to be strong. The overall amount of municipal bond debt outstanding has not materially changed in the last 20 years; over the same period, total US corporate debt has doubled and federal debt has tripled.3 Total financial assets for state and local governments are at an all-time nominal high, with notable strength in reserve funds, and expenditures have begun to moderate.4 Ratings agencies maintain a positive bias toward muni bonds, as upgrades continue to outpace downgrades; moreover, most of the defaults we saw last year were idiosyncratic in nature.5
We believe both technical and fundamental dynamics may continue to be supportive of municipal bonds in 2025. While munis declined in tandem with Treasuries immediately following the outcome of the US presidential election in November, the market reversed shortly thereafter.6 There has been much rhetoric around potential policy impacts of Trump’s victory, but specifics remain to be seen. An extension of the individual taxpayer provisions in 2017’s Tax Cuts and Jobs Act seems likely given a unified Republican government, but narrow majorities in the House and Senate mean there are no guarantees. More importantly, ongoing economic growth and labor-market strength is likely to support robust tax revenues and healthy fiscal dynamics for municipalities, as well as high recovery rates in the event of bond defaults. Continued monetary easing—the latest projection from the Fed suggests an additional 50 basis points worth of cuts to the policy rate in 2025, which would bring it to a range of 3.75–4.00%—could provide additional support to muni bonds.7
Dispersion Brings Opportunity
Though it has pulled back alongside Treasuries, the muni bond market continues to offer investors yields above the historical average, as shown in Exhibit 2. Importantly, however, the fragmentation of the very large muni market results in significant dispersion of yields and prices for similar bonds, particularly lower in the credit-quality spectrum. This is most notable among those bonds not assigned a credit rating by a nationally recognized statistical rating organization (NRSRO)—i.e., unrated bonds. Exhibit 3 depicts the much wider range of yields and prices among unrated bonds within the S&P Municipal Yield Index compared to the AA/Aa2-rated cohort. In our view, this dispersion represents a bountiful hunting ground where active managers can leverage their credit underwriting skills to identify bonds that are undervalued relative to the overall market.
Exhibit 2. Muni Yields Remain Higher than the Historical Average at the Index Level…
Bloomberg US Municipal Bond Index Yield to Worst, January 2003 through December 2024
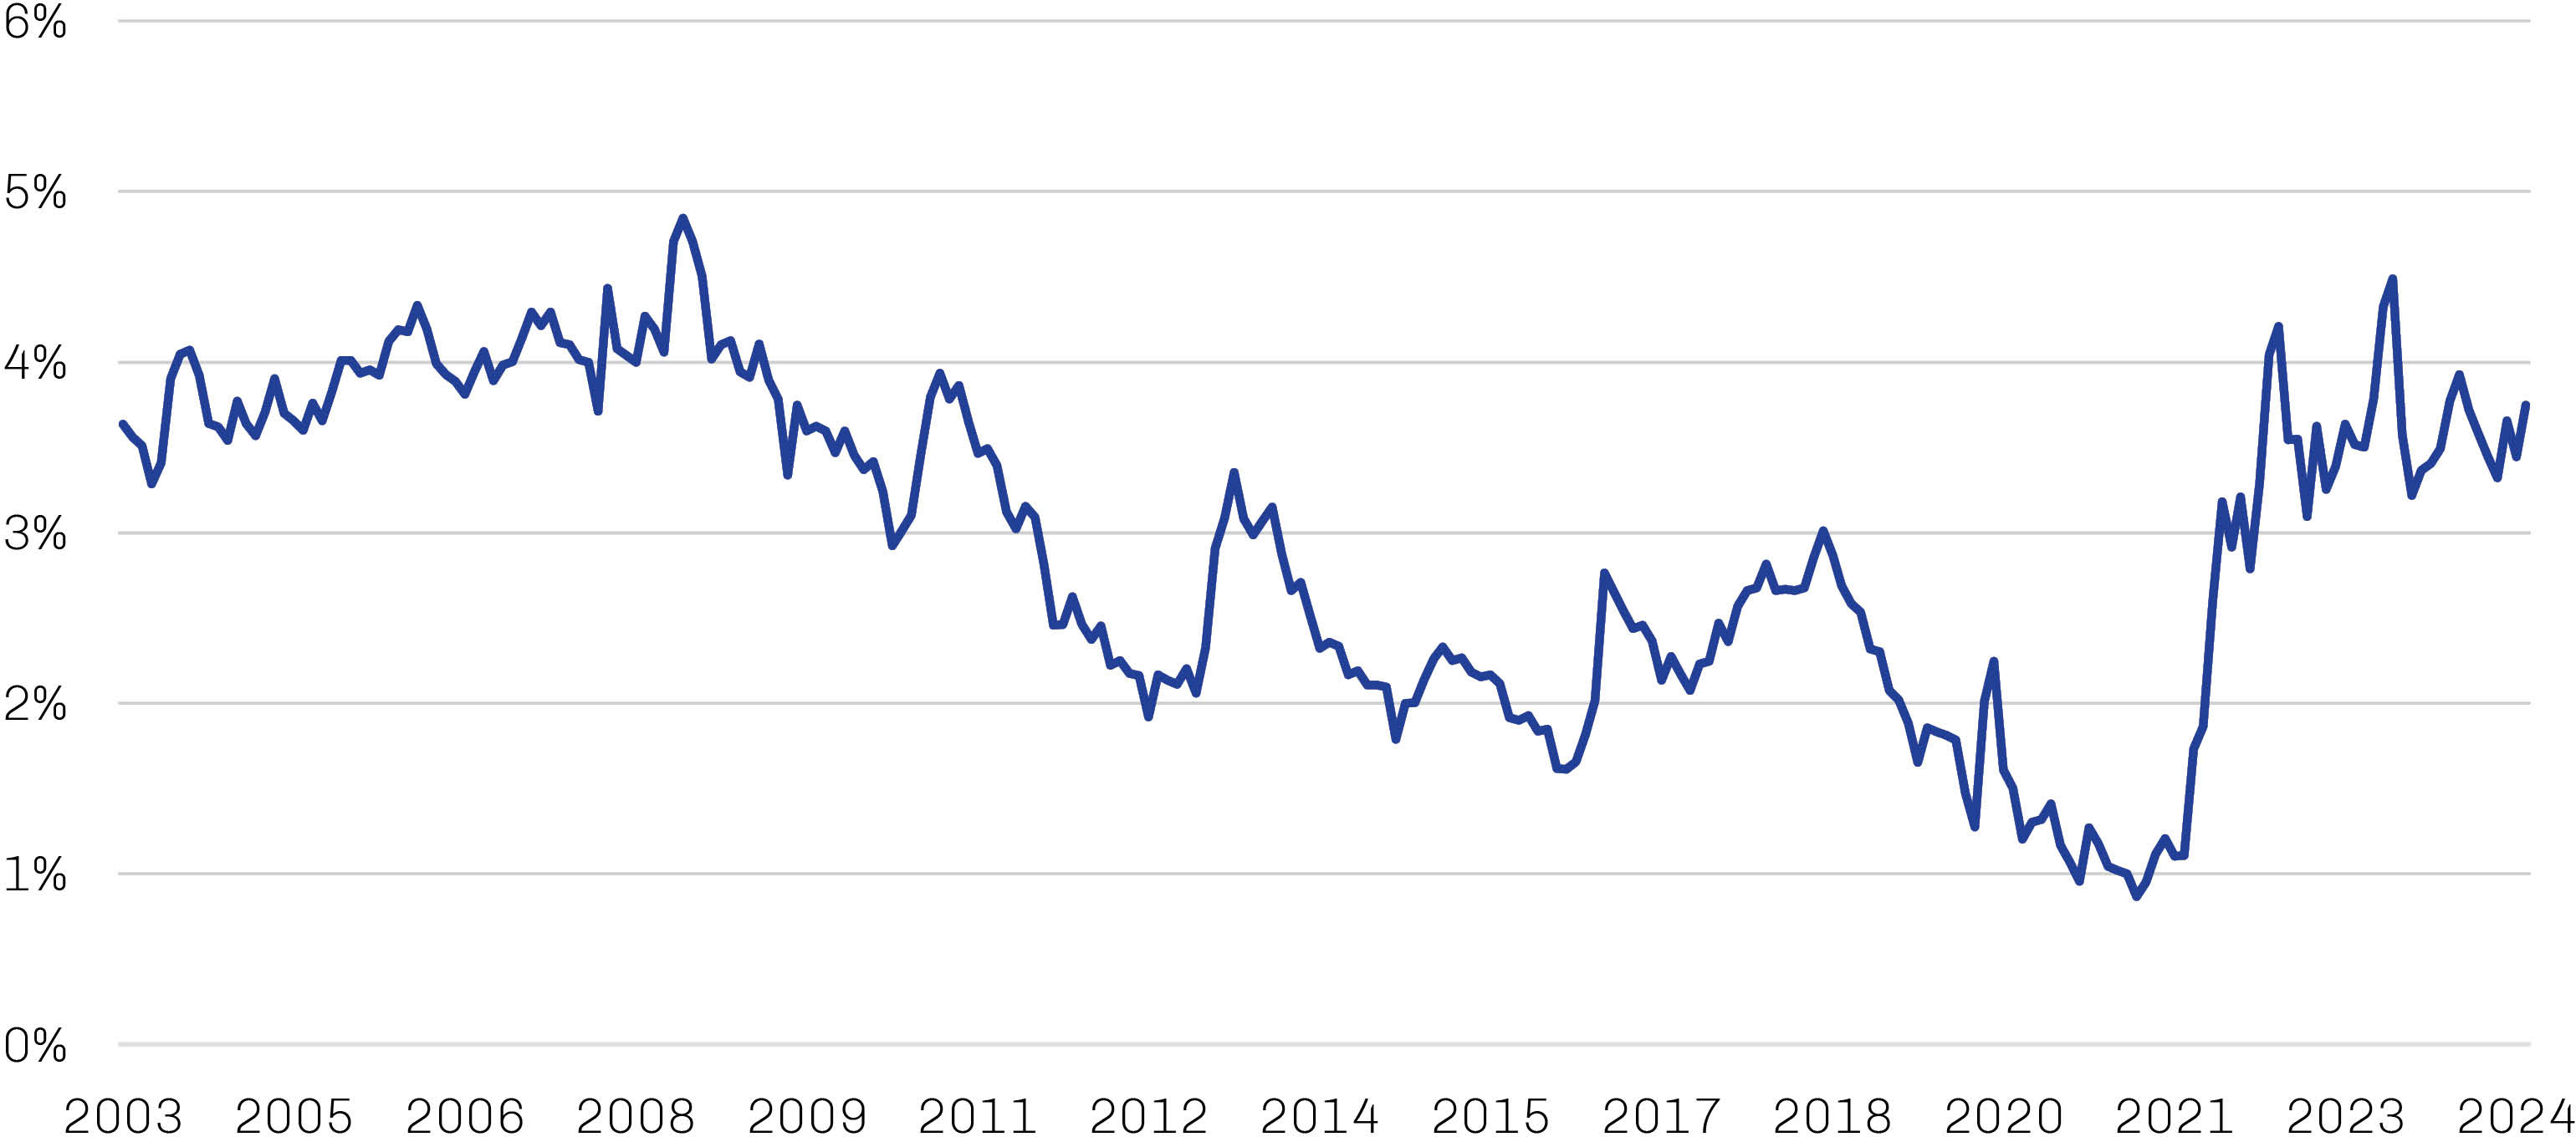
Note: Yield to worst is a financial metric that helps investors assess the minimum yield they can expect from a bond under various scenarios. It accounts for the bond’s yield in the worst-case scenario, considering factors like call provisions, prepayments and other features that may affect the bond’s cash flows.
Source: Bloomberg; data as of December 31, 2024.
Exhibit 3. …but Significant Price and Yield Dispersion Exists Among Individual Credits
Comparison of Bonds in the S&P Municipal Yield Index with 2044 Maturities
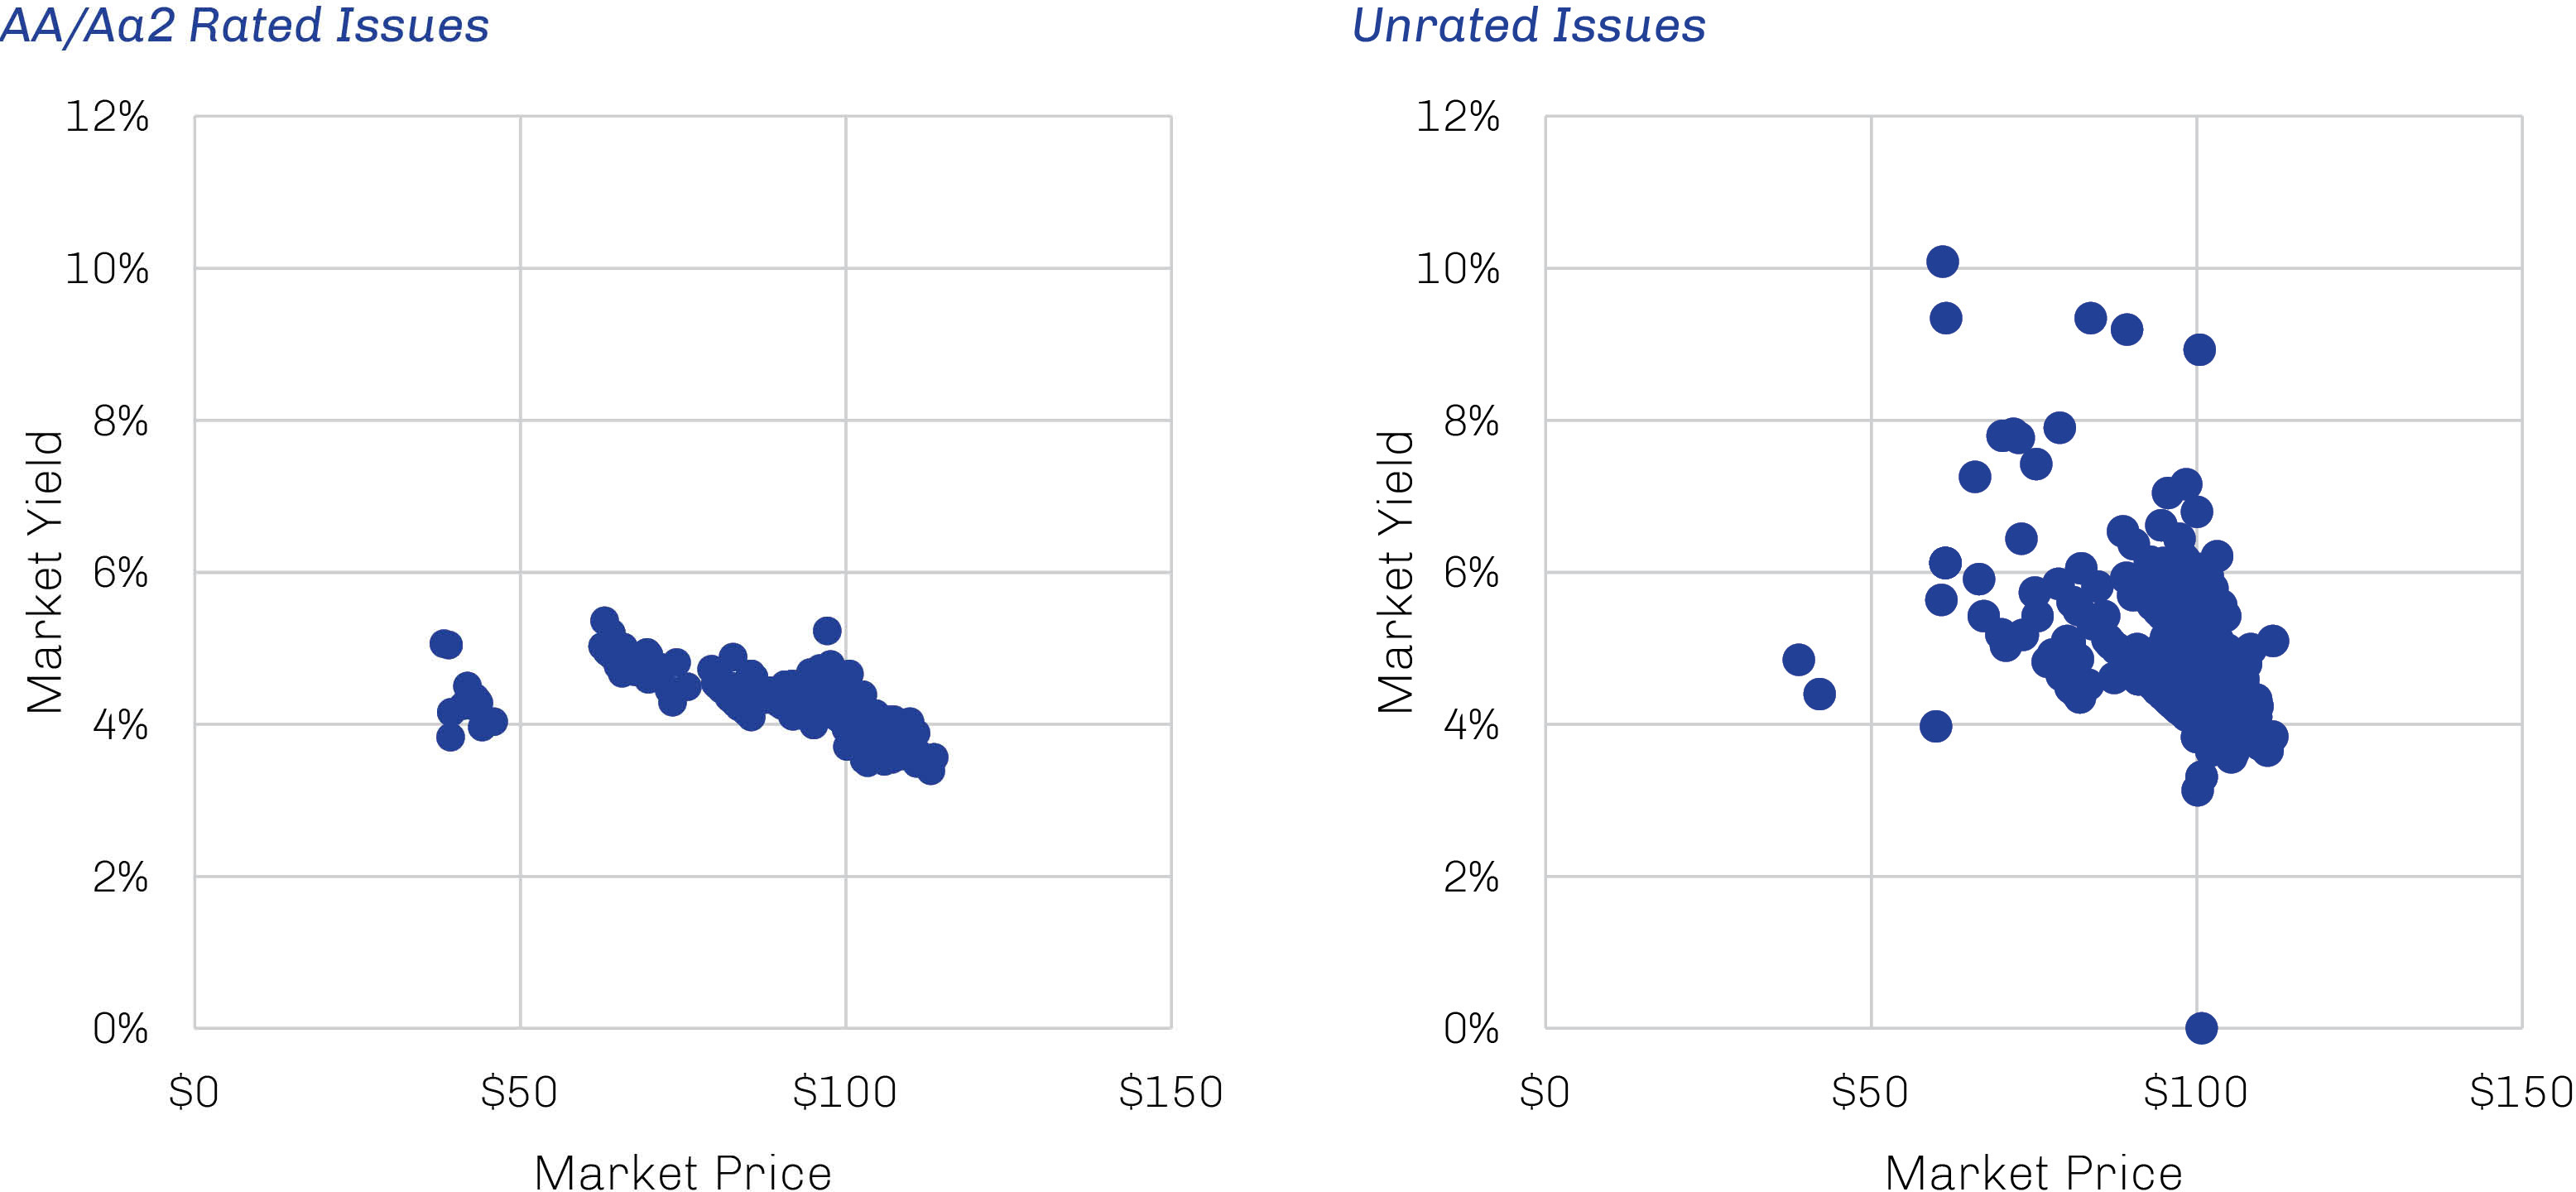
Source: Bloomberg; data as of December 31, 2024.
Unrated ≠ Uninvestible
The High Yield Municipal Credit team's investment philosophy often leads us to areas of our universe where we believe our expertise in credit analysis and security selection gives us an advantage. Unrated bonds—a segment that comprises approximately two-thirds of the S&P Municipal Bond High Yield Index based on number of issues—are a prominent example.8
While unrated bonds have not been subject to the proprietary scrutiny of the likes of Moody’s or S&P Global Ratings, we don’t believe their lack of rating should be interpreted as a reflection of the borrower’s capacity to meet its financial commitments. There are a number of reasons a muni bond may go unrated at the time of issuance, the most straightforward of which is the cost. Issuers must pay a fee to the agency for its rating and also typically incur additional costs associated with preparing information for the agency; small offerings—which are not unusual in the muni space—may not find the expense of achieving a rating worthwhile relative to the proceeds raised.
Though not necessarily riskier than any other muni bonds, the lack of rating lands not-rated bonds in the noninvestment grade bucket. To compensate for greater complexity and information risk involved with these bonds, they typically pay investors a higher yield compared to rated issuers of similar quality; as a result, skilled credit managers may find favorable yields relative to credit quality and default risk.
As an example, let’s consider land-secured muni bonds—aka, “dirt bonds”. Typically unrated, dirt bonds are issued by a public agency in partnership with a developer to finance infrastructure improvements such as roads, sidewalks and utilities for new residential communities. As the bonds’ proceeds fund a capital improvement that provides a public benefit, they typically are issued tax exempt. They are secured by a tax lien assigned to the property that is commonly paid off over a 30-year term through an annual special assessment coequal with property taxes. Development projects can be risky, especially in the early stages, but dirt bonds typically offer yields that we believe more than compensate for these risks compared to other forms of municipal financing, along with structural features that further enhance their appeal.
As the performance of dirt bonds is dependent on the progression of the project being financed and ultimately its sale to end users once developed, underwriting these opportunities entails the analysis of a great number of factors. For example, we would look at the master developer’s financial resources and ability to maintain the project through any potential downturns in the real estate market. We would assess the ratio of debt to equity for the project to determine the developer’s skin in the game. From a top-down prospective, we evaluate local and national economic trends—such as job growth in the area and prevailing mortgage rates—that may impact the project’s success. Finally, we would evaluate the structure of the deal, including any security features or credit enhancements built into the bond indentures.
As these projects progress and begin to generate revenue from a diversified tax base, the bonds may appreciate in price as the risk level recedes. Moreover, upon achieving certain development and revenue milestones, issuers may be able to refinance (or “refund” in muni parlance) the bonds, potentially at a lower interest rate and with an NRSRO rating.
Within this important high yield category, we currently focus much of our attention on Florida, Texas and Utah, where population growth is being fueled by low taxes, above-average job creation and better housing affordability. There continues to be a severe housing shortage across the US because of a structural undersupply of new construction following the global financial crisis. More than one million single-family homes need to be built every year to keep pace with the country’s household formation, but commercial homebuilders are falling short.9 The impact of new-home underbuilding has been exacerbated by the limited supply of existing homes for sale, as the “lock-in effect” of low mortgage rates has disincentivized homeowners from selling. This dynamic also has enabled homebuilders to take share from the resale market; new-home sales now account for more than 30% of all homes sold, double the pre-Covid rate.10 With new housing developments selling quickly and taxpayers revenue streams thus diversifying at a similar pace, the credit quality of many dirt bonds has improved.
This improved credit quality also illustrates that not all speculative bonds are created equal and highlights why the differentiated risk/reward profile of unrated bonds may offer opportunity. Further, high yield municipal bonds have a far lower historical default rate than comparable corporate issues. While a typical unsecured corporate bond is backed by nothing other than the issuer’s
creditworthiness and a contractual obligation to repay, municipal bonds generally include some sort of structural enhancement bolstering their risk profiles. General obligation bonds, for example, are backed by the full faith and credit of the issuing municipality, which includes its taxing power. Revenue bonds are linked to income streams generated by specific projects or public works, such as those generated by a toll road or hospital. All told, speculative-grade municipal bonds had an average trailing-12-month default rate of just under 1% for the period 1970 to 2022 compared to 4% for similarly rated corporates.11
Seeking Resilience in Fertile Ground
While we are constructive on the municipal market as a whole, our investment process takes us to unloved, overlooked or contrarian areas of the market where we believe fundamental, research-driven investment managers may be able to uncover particularly attractive opportunities. With about $4 trillion distributed across more than one million distinct municipal bonds and 50,000 issuers, the highly fragmented municipal bond market is subject to significant yield dispersion among its constituents, particularly those without ratings.12 We believe this dispersion offers rigorous, fundamental credit managers an opportunity to source bonds whose yields and prices more than adequately compensate for the credit risk involved.