


Commentaries
Global Equity ETF Commentary
Global Equity ETF Commentary
Portfolio Review
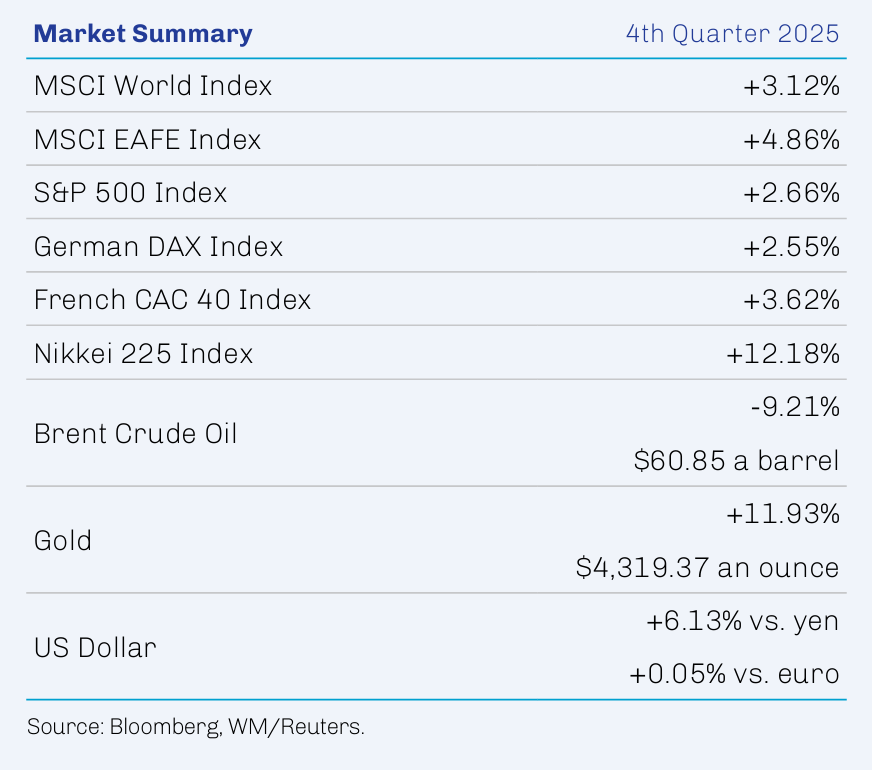
The Global Equity ETF posted a return of 5.58% in fourth quarter 2025. All regions contributed to performance; North America and emerging markets were the leading contributors while developed Asian excluding Japan and Japan lagged. Industrials and healthcare were the largest contributors among equity sectors, while consumer discretionary was the only detractor and real estate was flat. The Global Equity ETF outperformed the MSCI World Index in the period.
Leading contributors in the First Eagle Global Equity ETF this quarter included Samsung Electronics Co., Ltd., Alphabet Inc. Class C, Barrick Mining Corporation, C.H. Robinson Worldwide, Inc. and Taiwan Semiconductor Manufacturing Co., Ltd.
Samsung Electronics is a global technology company and major manufacturer of diverse electronic components with a dominant presence in memory semiconductors. Results during the quarter reflect continued strong demand and shortage-induced pricing strength for DRAM chips and persistent demand from hyperscalers driven by AI infrastructure buildouts amid tight supply.
Shares of Alphabet, the parent company of Google and YouTube, were strong during the quarter on the successful rollout of its large language model Gemini 3. Market enthusiasm remains strong for Alphabet’s full-stack AI solution, encompassing research, infrastructure/data centers and integrated end products. With a valuation that is still reasonable, in our view, the company continues to share its ample store of cash with investors through buybacks and quarterly dividends.
Canada’s Barrick Mining is the world’s second-largest gold producer by output. Strong gold and copper prices drove cash flows during the quarter, and operating leverage was enhanced by resumed gold production in Mali, which had been suspended in January 2025. Media reports about a potential acquisition of the company by Newmont, though unconfirmed, served as an additional boost to the stock during the quarter, as did the announcement of a stake in the company by an activist investor. As management reviews strategic actions to unlock value, including a possible initial public offering (IPO) of its North American assets, Barrick shareholders continue to benefit from stock buybacks.
C.H. Robinson is the largest freight broker in North America, linking transportation providers to businesses across industries. Shares rallied in anticipation of improved fundamentals. Stricter licensing requirements from the US Department of Transportation could support stronger pricing and ease insurance costs. Overall cost containment—including through AI-assisted automated processes— support higher structural margins coming into the next upcycle for the industry.
Taiwan Semiconductor (TSMC) is the world’s largest semiconductor foundry, a primary manufacturer of advanced chips used in generative artificial intelligence for clients including Nvidia, Broadcom, Intel, Advanced Micro Devices and Apple. Hyperscaler capex—driven by AI infrastructure buildouts—continues to drive demand, while capacity constraints underpin strong pricing.
The leading detractors in the quarter were Oracle Corporation, Alibaba Group Holding Ltd., Meta Platforms, Inc. Class A, Prosus N.V. Class N and BAE Systems plc.
Oracle is one of the world’s largest independent enterprise software companies, and the stock traded down in the fourth quarter after a very strong rally through September. Oracle has been aggressively building out its AI infrastructure, and its capital-intensive strategy has required the company to take on significant debt. Though it has a robust backlog with customers like Meta and Nvidia, markets appear concerned about the ultimate profitability of its data-center spending. Moreover, there was speculation that Google’s Gemini 3 launch gave it the lead in AI search over OpenAI, with which Oracle has a strategic infrastructure partnership. Data center capacity is fungible, and we continue to believe Oracle should be positioned to capture recurring and sustainable revenue streams by providing services that support the use and adoption of AI.
Shares of tech giant Alibaba traded down following several quarters of strong performance. The company continued to capitalize on the AI boom in China and reported accelerating sales growth in its cloud business for its most recent quarter. With large AI infrastructure and data centers and leading open-source and frontier large language models, the company has an attractive position in China’s AI ecosystem. Alibaba’s core e-commerce business continues to grow, but higher costs associated with large investments in quick commerce categories like food delivery weighed on the stock. We like Alibaba’s dominant market position, its strong execution capabilities and focus on returning cash to shareholders through dividends and stock repurchases.
Shares of Meta—the parent company of Facebook, Instagram and WhatsApp, among other social-media platforms—declined during the quarter due to concerns about its AI capex and a number of high-profile employee departures. We believe that Meta is able to focus on both profitability and efficiency in conjunction with ongoing investments in its core advertising business, the metaverse and other AI applications, as well as the company’s potential to generate cash and its unique portfolio of assets.
Prosus is a global technology company domiciled in Holland with a portfolio of private equity investments and an approximate 25% ownership stake in China’s publicly traded technology company Tencent, which is Prosus’s largest holding. Tencent shares traded down following strong performance for several quarters. However, it has been executing well and reported strong revenue and income growth for its most recent quarter. We also like Prosus’s ongoing shift away from early-stage venture investing toward more established, cash-generative business at reasonable multiples.
BAE Systems, the largest defense contractor in the UK, traded lower following several quarters of strong performance. The company is well positioned to benefit from prospectively higher defense spending throughout Europe in the face of uncertain military support from the US, a commitment to which was underscored by the recent agreement among NATO members to increase their defense spending. BAE’s long-term government contracts generate recurring revenues that underpin strong backlogs and cyclical resilience.
We appreciate your confidence and thank you for your support.
Sincerely,
First Eagle Investments
1. Source: FactSet; data as of December 31, 2025.
2. Source: Bloomberg; data as of December 31, 2025.
3. Source: Haver Analytics, Bureau of Economic Analysis, US Treasury, Federal Reserve Bank of St. Louis; data as of December 31, 2025.
4. Source: US Treasury; data as of September 30, 2025.
5. Source: Bloomberg; data as of December 31, 2025.
6. Source: Haver, International Monetary Fund, First Eagle Investments; data as of October 31, 2025.
7. Source: Federal Reserve Bank of St. Louis, US Bureau of Economic Analysis; data as of December 31, 2025.
8. Source: Federal Reserve Bank of St. Louis; data as of December 31, 2025.
9. Source: Bank for International Settlements; data as of January 7, 2026.
10. Source: S&P Capital IQ, Bloomberg and company reports; data as of December 31, 2025.
11. Source: Bloomberg, First Eagle Investments; data as of September 30, 2025.
12. Source: Bloomberg; data as of December 31, 2025.
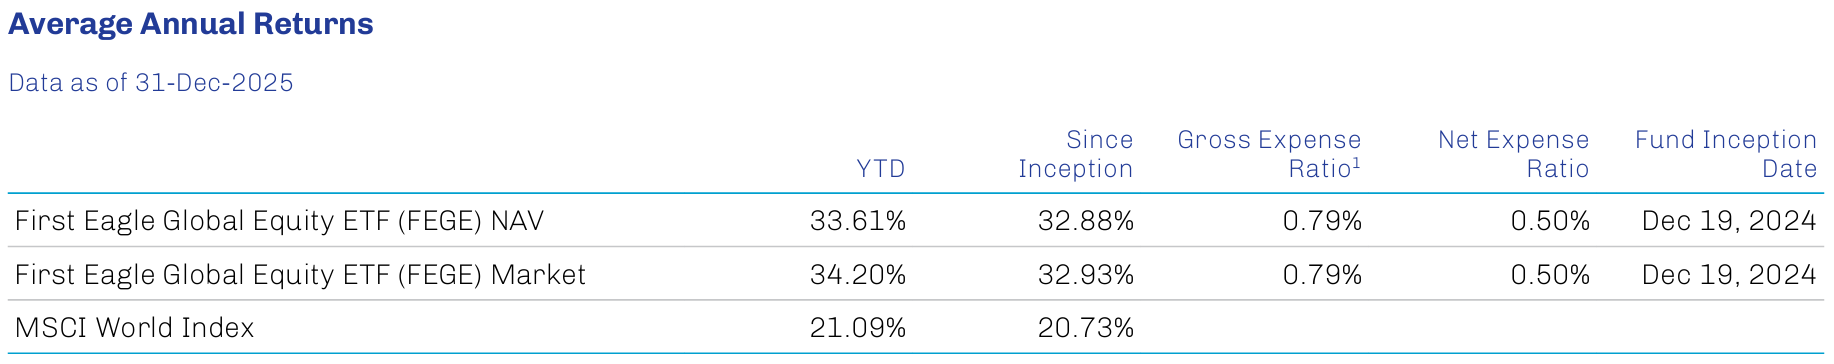
The performance data quoted herein represent past performance and do not guarantee future results. Market volatility can dramatically impact the Fund’s short-term performance. Current performance may be lower or higher than figures shown. The investment return and principal value will fluctuate so that an investor’s shares, when redeemed, may be worth more or less than their original cost. Past performance data through the most recent month-end are available at www.firsteagle.com.
1. Average annual returns are historical and reflect changes in share price, reinvested dividends and are net of expenses. Operating expenses reflect the Fund’s total annual operating expenses for the share class as of the Fund’s most current prospectus, including management fees and other expenses.
First Eagle Investment Management, LLC (the “Adviser”) has contractually agreed to waive and/or reimburse certain fees and expenses so that the total annual fund operating expenses (excluding Acquired Fund Fees and Expenses (“AFFE”), brokerage commissions, extraordinary items, interest or taxes) (“annual operating expenses”) is limited to 0.50% of the Fund’s average daily net assets. These contractual limitations are in effect until 31-Dec-2026, and may not be terminated prior to that date without the approval of the Board of Trustees (the “Board”) of The RBB Fund Trust (the“Trust”).
Investments are not FDIC insured or bank guaranteed and may lose value.
Risks
All investments involve the risk of loss of principal.
Diversification does not guarantee investment returns and does not eliminate the risk of loss.
ETFs are subject to additional risks that do not apply to conventional mutual funds, including the risks that the market price of an ETF’s shares may trade at a premium or discount to its net asset value, an active secondary trading market may not develop or be maintained, or trading may be halted by the exchange in which they trade, which may impact an ETF’s ability to sell its shares. Shares of any ETF are bought and sold at market price (not NAV) and are not individually redeemed from the ETF. Brokerage commissions will reduce returns. There are risks associated with investing in securities of foreign countries, such as erratic market conditions, economic and political instability and fluctuations in currency exchange rates. These risks may be more pronounced with respect to investments in emerging markets. A principal risk of investing in value stocks is that the price of the security may not approach its anticipated value or may decline in value. “Value” investments, as a category, or entire industries or sectors associated with such investments, may lose favor with investors as compared to those that are more “growth” oriented. Investment in gold and gold-related investments present certain risks, and returns on gold related investments have traditionally been more volatile than investments in broader equity or debt markets.
Definitions
Gross domestic product (GDP) measures the total value of all economic output in goods and services for an economy. Free cash flow measures the amount of cash a company generates from operations after paying capital expenditures.
MSCI World Index (Net) measures the performance of large and midcap equities across developed markets countries. A net-return index tracks price changes and reinvestment of distribution income net of withholding taxes. MSCI EAFE Index (Net) measures the performance of large and midcap equities across developed markets countries around the world excluding the US and Canada. A net-return index tracks price changes and reinvestment of distribution income net of withholding taxes. S&P 500 Index (Gross/Total) measures the performance of 500 of the top companies in the leading industries of the US economy and is widely recognized as a proxy for the US market as a whole. A total-return index tracks price changes and reinvestment of distribution income. Nikkei 225 is a price-weighted index composed of 225 stocks in the Prime Market of the Tokyo Stock Exchange. It is widely recognized as a proxy for the Japanese equity market as a whole. German DAX® Index measures the performance of the 40 largest companies listed on the Frankfurt Stock Exchange that fulfil certain minimum quality and profitability requirements. It is widely recognized as a proxy for the German equity market as a whole. CAC 40® Index is a free-float market capitalization-weighted index that measures the performance of the 40 largest and most actively traded shares listed on Euronext Paris.
Indexes are unmanaged and do not incur management fees or other operating expenses. One cannot invest directly in an index.
The holdings mentioned herein represent the following total assets of the First Eagle Global Equity ETF as of 12/31/2025: Samsung Electronics Co., Ltd. 3.27%; Alphabet Inc. Class C 2.76%; Barrick Mining Corporation 2.01%; C.H. Robinson Worldwide, Inc. 2.30%; Taiwan Semiconductor Manufacturing Co., Ltd. 1.99%; Oracle Corporation 2.08%; Alibaba Group Holding Ltd. 1.14%; Meta Platforms, Inc. Class A 2.23%; Prosus N.V. Class N 1.94%; BAE Systems plc 1.02%.
Additional Disclosures
This commentary represents the opinion of the Global Value team as of the date noted. The opinions expressed are not necessarily those of the firm. These materials are provided for informational purposes only. These opinions are not intended to be a forecast of future events, a guarantee of future results or investment advice. Any statistics contained herein have been obtained from sources believed to be reliable, but the accuracy of this information cannot be guaranteed. The views expressed herein may change at any time subsequent to the date of issue hereof. The information provided is not to be construed as a recommendation to buy, hold or sell or the solicitation or an offer to buy or sell any fund or security.
The Fund’s portfolio is actively managed and holdings can change at any time. Current and future portfolio holdings are subject to risk.
The investment process may change over time. The information set forth above is intended as a general illustration of some of the criteria the investment team considers in selecting securities. Not all investments will meet such criteria.
The opinions expressed are not necessarily those of the firm. These materials are provided for informational purposes only. These opinions are not intended to be a forecast of future events, a guarantee of future results or investment advice. Any statistics contained herein have been obtained from sources believed to be reliable, but the accuracy of this information cannot be guaranteed. The views expressed herein may change at any time subsequent to the date of issue hereof.
Third-party marks are the property of their respective owners.
As with all ETFs, shares may be bought and sold in the secondary market at market prices. Investments involve risk. Principal loss is possible.
Investors should consider the investment objectives, risks, and charges and expenses of the First Eagle ETFs carefully before investing. The prospectus and summary prospectus contain this and other information about our funds and may be obtained by visiting our website at www.firsteagle.com or calling us at 800-617-0004. The prospectus or summary prospectus should be read carefully before investing.
First Eagle ETFs are Distributed by Quasar Distributors, LLC.