


Commentaries
Global Equity ETF Commentary
Global Equity ETF Commentary
Portfolio Review
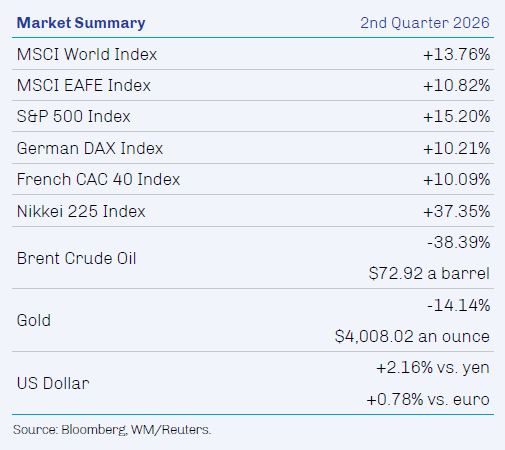
The Global Equity ETF posted a return of 4.97% in second quarter 2026. Emerging markets and developed Europe were the leading contributors while developed Asian excluding Japan was the only detractor and North America lagged. Information technology and consumer staples were the largest contributors among equity sectors while energy and materials detracted. The Global Equity ETF underperformed the MSCI World Index in the period.
Leading contributors in the First Eagle Global Equity ETF this quarter included Samsung Electronics Co., Ltd., Alphabet Inc. Class C, Merck KGaA, Elevance Health, Inc. and Texas Instruments Incorporated.
Samsung Electronics is a global technology company and major manu¬facturer of diverse electronic components with a dominant presence in memory semiconductors. Shares performed well as strong pricing for both dynamic random-access memory (DRAM) and NAND memory chips underpinned earnings growth. Persistent demand from hyperscalers and long-term supply agreements underpin market expectations for sustained robust profitability.
Shares of Alphabet—the parent company of Google and YouTube—rose during the quarter as contracted future revenues from cloud operations continued to be strong, amplified by explosive demand for AI infrastructure, strong AI-focused memory chip production and resilient digital-ad sales. Google’s full-stack AI solution underpins prospective long-term momentum for the company, with an anticipated near-term boost from hosting OpenAI’s latest generative AI model.
Merck KGaA is a global life science, healthcare and electronics company based in Germany. Sales for the cancer drug Keytruda were strong during the quarter. Additionally, as the company announced its definitive agreement to acquire US life science tool company Bio-Techne, investors welcomed Merck’s shift away from midsize European pharma to instead focus on higher-quality, faster-growing, longer-duration franchises.
Shares of Elevance Health, the health insurer and healthcare-services provider formerly known as Anthem, rallied during the quarter as margins expanded—after a protracted decline—due to declining medical costs, stronger pricing and increased utilization with higher premiums.
Texas Instruments designs, manufactures and sells analog and embedded processing chips for vital functions in a broad array of applications. Shares were strong during the quarter as sustained AI demand for graphic processing units (GPUs), central processing units (CPUs) and connecting-network systems underpinned the need for TI’s analog semiconductors to manage power, battery systems and networking systems. Higher than expected earnings guidance further fortified returns.
The leading detractors in the quarter were Noble Corporation PLC Class A, Charter Communications, Inc. Class A, HCA Healthcare Inc., Exxon Mobil Corporation and Agnico Eagle Mines Limited.
Noble is a deepwater drilling contractor for the oil and gas industry. While the company is not impacted by the flow of traffic through the Strait of Hormuz, its shares traded down along with the broader decline in oil prices. We believe that Noble is relatively insulated from tensions in the Middle East because its revenue stream is tied entirely to deepwater drilling, which we believe should benefit from increased upstream exploration and development over the coming decade.
Charter Communications is the second-largest broadband communications service company in the US, providing cable broadcasting, internet, voice and mass-media services. Cable providers in general remain under competitive pressure from mobile operators, which are scaling up entry-level fixed wireless service. We continue to view Charter as a high-quality business with difficult-to-replicate assets that generate steady cash flows and returns cash to shareholders.
HCA Healthcare is the largest for-profit hospital operator in the US, with a difficult-to-replicate network of large urban hospitals. Although the company reported sales and profit growth for its most recent growth, HCA reported that patient volumes grew at the low end of guidance, driven partially by declines in respiratory-related emergency room visits, inpatient surgeries and outpatient surgeries. A decrease in enrollment in both Medicaid and Affordable Care Act exchanges was also a headwind. We continue to view HCA’s management as an effective steward of both operations and the balance sheet as it continues to return capital to shareholders through share buybacks.
Shares of integrated oil and gas giant Exxon Mobil traded down alongside easing crude oil prices. Although the company experienced disruptions in its Middle East operations, it reported better-than-expected results for its most recent quarter because of improved production from assets in Guyana and the Permian Basin. We continue to view Exxon as a high-quality operator with strong capital discipline, an attractive portfolio of durable assets and a commitment to returning cash to shareholders.
Agnico Eagle is the world’s second-largest gold producer. Although the company reported record operational results for its most recent quarter, shares of Agnico traded down with gold bullion prices. We continue to like the company’s strong balance sheet, healthy pipeline of projects, cost-efficient operations and focus on returning cash to shareholders.
1. Source: FactSet; data as of June 30, 2026.
2. Source: FactSet; data as of June 30, 2026.
3. Source: Bloomberg, Federal Reserve, Goldman Sachs; data as of June 30, 2026.
4. Source: Federal Reserve; data as of March 31, 2026.
5. Source: Federal Reserve, Haver Analytics; data as of March 31, 2026.
6. Source: Bloomberg; data as of June 30, 2026.
7. Source: yCharts; data as of June 30, 2026.
8. Source: Bureau of Economic Analysis; data as of May 31, 2026.
9. Source: Reuters; data as of March 17, 2026.
10. Source: Bloomberg; data as of June 30, 2026.
11. Source: World Gold Council; data as of June 16, 2026.
12. Source: FactSet; data as of June 30, 2026.
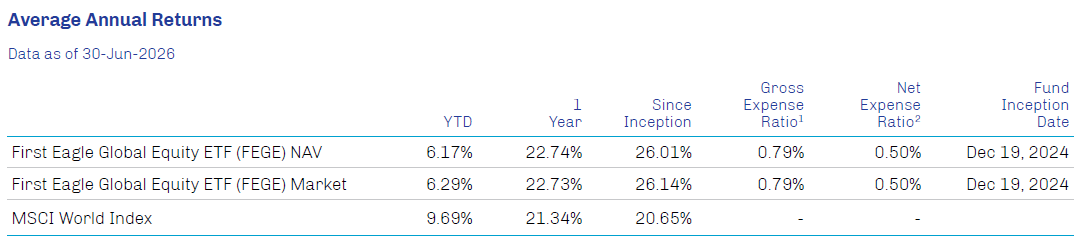
The performance data quoted herein represent past performance and do not guarantee future results. Market volatility can dramatically impact the Fund’s short-term performance. Current performance may be lower or higher than figures shown. The investment return and principal value will fluctuate so that an investor’s shares, when redeemed, may be worth more or less than their original cost. Past performance data through the most recent month-end are available at www.firsteagle.com. Investments are not FDIC insured or bank guaranteed and may lose value.
1. Gross expense ratio is the total annual fund operating expenses before fee waivers.
2. The net expense ratio is the gross expense ratio after waivers and/or reimbursements.
First Eagle Investment Management, LLC (the “Adviser”) has contractually agreed to waive and/or reimburse certain fees and expenses so that the total annual fund operating expenses (excluding Acquired Fund Fees and Expenses (“AFFE”), brokerage commissions, extraordinary items, interest or taxes) (“annual operating expenses”) is limited to 0.50% of the Fund’s average daily net assets. These contractual limitations are in effect until 31-Dec-2026, and may not be terminated prior to that date without the approval of the Board of Trustees (the “Board”) of The RBB Fund Trust (the “Trust”).
Average annual returns are historical and reflect changes in share price, reinvested dividends and are net of expenses. Operating expenses reflect the Fund’s total annual operating expenses for the share class as of the Fund’s most current prospectus, including management fees and other expenses.
Investments are not FDIC insured or bank guaranteed and may lose value.
The annual expense ratio is based on expenses incurred by the Fund, as stated in the most recent prospectus.
Risks
All investments involve the risk of loss of principal.
Diversification does not guarantee investment returns and does not eliminate the risk of loss.
ETFs are subject to additional risks that do not apply to conventional mutual funds, including the risks that the market price of an ETF’s shares may trade at a premium or discount to its net asset value, an active secondary trading market may not develop or be maintained, or trading may be halted by the exchange in which they trade, which may impact an ETF’s ability to sell its shares. Shares of any ETF are bought and sold at market price (not NAV) and are not individually redeemed from the ETF. Brokerage commissions will reduce returns.
There are risks associated with investing in securities of foreign countries, such as erratic market conditions, economic and political instability and fluctuations in currency exchange rates. These risks may be more pronounced with respect to investments in emerging markets.
A principal risk of investing in value stocks is that the price of the security may not approach its anticipated value or may decline in value. “Value” investments, as a category, or entire industries or sectors associated with such investments, may lose favor with investors as compared to those that are more “growth” oriented.
Investment in gold and gold-related investments present certain risks, and returns on gold related investments have traditionally been more volatile than investments in broader equity or debt markets.
Definitions
Federal funds rate is the interest rate at which depository institutions (banks and credit unions) lend reserve balances to other depository institutions overnight on an uncollateralized basis. Gross domestic product (GDP) measures the total value of all economic output in goods and services for an economy.
MSCI World Index (Net) measures the performance of large and midcap equities across developed markets countries. A net-return index tracks price changes and reinvestment of distribution income net of withholding taxes. MSCI EAFE Index (Net) measures the performance of large and midcap equities across developed markets countries around the world excluding the US and Canada. A net-return index tracks price changes and reinvestment of distribution income net of withholding taxes. MSCI World Growth Index (Net) measures the performance of large and midcap equities exhibiting overall growth style characteristics across developed markets. Growth investment style characteristics are defined using long-term forward EPS growth rate, short-term forward EPS growth rate, current internal growth rate, long-term historical EPS growth trend, and long-term historical sales per share growth trend. A net-return index tracks price changes and reinvestment of distribution income net of withholding taxes. S&P 500 Index (Gross/Total) measures the performance of 500 of the top companies in the leading industries of the US economy and is widely recognized as a proxy for the US market as a whole. A total-return index tracks price changes and reinvestment of distribution income. Nikkei 225 is a price-weighted index composed of 225 stocks in the Prime Market of the Tokyo Stock Exchange. It is widely recognized as a proxy for the Japanese equity market as a whole. German DAX® Index measures the performance of the 40 largest companies listed on the Frankfurt Stock Exchange that fulfil certain minimum quality and profitability requirements. It is widely recognized as a proxy for the German equity market as a whole. CAC 40® Index is a free-float market capitalization-weighted index that measures the performance of the 40 largest and most actively traded shares listed on Euronext Paris.
Indexes are unmanaged and do not incur management fees or other operating expenses. One cannot invest directly in an index.
These holdings represent the top five contributors and detractors to performance for the First Eagle Global Equity ETF as of 06/30/2026: Samsung Electronics Co., Ltd. 3.53%; Alphabet Inc. Class C 2.79%; Merck KGaA 1.76%; Elevance Health, Inc. 1.94%; Texas Instruments Incorporated 0.00%; Noble Corporation PLC Class A 1.16%; Charter Communications, Inc. Class A 0.67%; HCA Healthcare Inc. 1.55%; Exxon Mobil Corporation 0.99%; Agnico Eagle Mines Limited 0.83%.
Additional Disclosures
This commentary represents the opinion of the Global Value team as of the date noted. The opinions expressed are not necessarily those of the firm. These materials are provided for informational purposes only. These opinions are not intended to be a forecast of future events, a guarantee of future results or investment advice. Any statistics contained herein have been obtained from sources believed to be reliable, but the accuracy of this information cannot be guaranteed. The views expressed herein may change at any time subsequent to the date of issue hereof. The information provided is not to be construed as a recommendation to buy, hold or sell or the solicitation or an offer to buy or sell any fund or security.
The Fund’s portfolio is actively managed and holdings can change at any time. Current and future portfolio holdings are subject to risk.
The investment process may change over time. The information set forth above is intended as a general illustration of some of the criteria the investment team considers in selecting securities. Not all investments will meet such criteria.
The opinions expressed are not necessarily those of the firm. These materials are provided for informational purposes only. These opinions are not intended to be a forecast of future events, a guarantee of future results or investment advice. Any statistics contained herein have been obtained from sources believed to be reliable, but the accuracy of this information cannot be guaranteed. The views expressed herein may change at any time subsequent to the date of issue hereof.
Third-party marks are the property of their respective owners.
As with all ETFs, shares may be bought and sold in the secondary market at market prices. Investments involve risk. Principal loss is possible.
Investors should consider investment objectives, risks, charges and expenses carefully before investing. The prospectus and summary prospectus contain this and other information about our funds and may be obtained by visiting our website at www.firsteagle.com or calling us at 800-334-2143. The prospectus or summary prospectus should be read carefully before investing.
First Eagle ETFs are distributed by Quasar Distributors, LLC.
©2026 First Eagle Investment Management, LLC. All rights reserved.