


Commentaries
High Yield Municipal Fund Commentary
High Yield Municipal Fund Commentary
* Performance for Class A shares without the effect of sales charges and assumes all distributions have been reinvested, and if a sales charge was included values would be lower.
1. Source: FactSet; data as of June 30, 2026.
2. Source: MSRB; data as of June 30, 2026.
3. Source: Federal Reserve; data as of June 30, 2026.
4. Source: MSRB; data as of June 30, 2026.
5. Source: Bloomberg; data as of June 30, 2026.
6. Source: National Association of State Budget Officers; data as of June 4, 2026.
7. Source: Milliman; data as of July 6, 2026.
8. Source: S&P Global; data as of June 30, 2026.
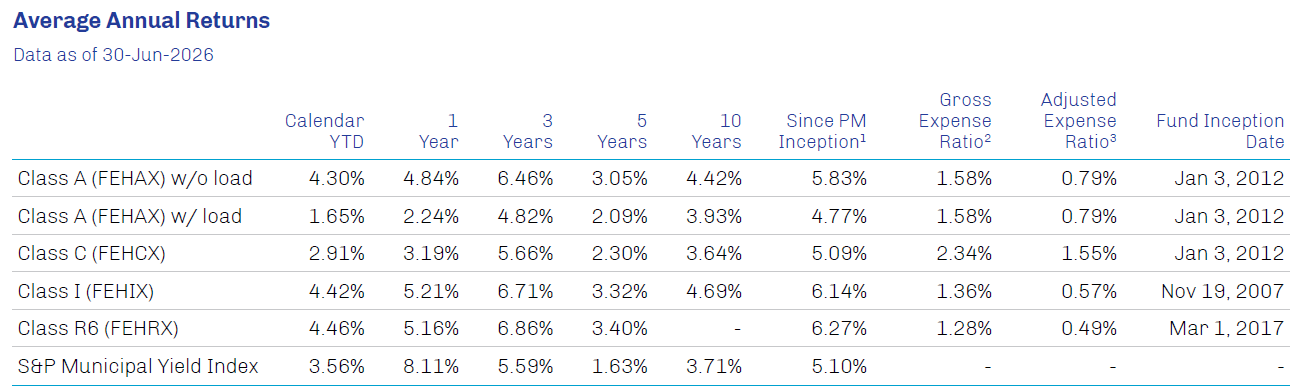
The performance data quoted herein represents past performance and does not guarantee future results. Market volatility can dramatically impact the fund’s short term performance. Current performance may be lower or higher than figures shown. The investment return and principal value will fluctuate so that an investor’s shares, when redeemed, may be worth more or less than their original cost. Past performance data through the most recent month end is available at www.firsteagle.com or by calling 800-334-2143. The average annual returns are historical and reflect changes in share price, reinvested dividends and are net of expenses. “With sales charge” performance for class A shares gives effect to the deduction of the maximum sales charge of 2.50%. The average annual returns for Class C shares reflect a CDSC (contingent deferred sales charge) of 1.00% in the year-to-date and first year only. Class I shares require $1MM minimum investment and are offered without sales charge. Class R6 shares are offered without sales charge. Operating expenses reflect the Fund’s total annual operating expenses for the share class of the Fund’s most current prospectus, including management fees and other expenses.
1. John Miller started as lead portfolio manager of the Fund beginning 2-Jan-2024.
2. Gross expense ratio is the total annual fund operating expenses before fee waivers.
3. First Eagle Investment Management, LLC (the “Adviser”) has contractually agreed to waive and/ or reimburse certain fees and expenses of Classes A, C, I, and R6 so that the total annual operating expenses (excluding interest charges on any borrowings, taxes, brokerage commissions and other expenses incurred in placing orders for the purchase and sale of securities and other investment instruments, acquired fund fees and expenses, dividend and other expenses relating to short sales, and extraordinary expenses, if any) (“annual operating expenses”) of each class are limited to 0.85%, 1.60%, 0.60%, and 0.60% of average net assets, respectively. Each of these undertakings lasts until 28-Feb-2027 and may not be terminated during its term without the consent of the Board of Trustees. The Fund has agreed that each of Classes A, C, I, and R6 will repay the Adviser for fees and expenses waived or reimbursed for the class provided that repayment does not cause annual operating expenses (after the repayment is taken into account) to exceed the lesser of: (1) 0.85%, 1.60%, 0.60%, and 0.60% of the class’ average net assets, respectively; or (2) if applicable, the then-current expense limitations. Any such repayment must be made within three years after the year in which the Adviser incurred the expense. The adjusted expense ratio excludes certain fees and expenses, such as interest expense and fees paid on Fund borrowings and/or interest and related expenses from inverse floaters.
Investments are not FDIC insured or bank guaranteed and may lose value.
The annual expense ratio is based on expenses incurred by the Fund, as stated in the most recent prospectus.
Inception date shown for the S&P Municipal Yield Index matches the High Yield Municipal Fund Class I shares, which have the oldest since inception date for the High Yield Municipal Fund.
The First Eagle High Yield Municipal Fund was known as the First Eagle High Income Fund prior to 27-Dec-2023. First Eagle High Income Fund commenced operations in its present form on 30-Dec-2011, and is successor to another mutual fund pursuant to a reorganization on 30-Dec-2011. Information prior to 30-Dec-2011 is for this predecessor fund. Immediately after the reorganization, changes in net asset value of the Class I shares were partially impacted by differences in how the Fund and the predecessor fund price portfolio securities.
Risks
All investments involve the risk of loss of principal.
Diversification does not guarantee investment returns and does not eliminate the risk of loss.
The transition of the First Eagle High Yield Municipal Fund (the “Fund”) from the First Eagle High Income Fund was effected on or about December 27, 2023. There continues to be increased operational risks associated with the transition, during which the Fund has acquired new and additional trading and counterparty relationships, new and additional borrowing and leverage arrangements, and new and additional capabilities for the management of derivatives, and may require more. Beyond the inherent risks of transition and associated complexity, because some, but not all of the required or desirable operational capabilities and investment and counterparty arrangements were fully implemented prior to the effective date of the transition, until such time as that occurs, the Fund’s flexibility to fully implement its new objective and strategies may continue to be limited during the transition period. During the transition period, it is expected that the Fund will not be as invested in income-producing securities that are exempt from regular federal income taxes as will be the case once the transition is complete. As a result, a higher percentage of the Fund’s dividends are expected to be ordinary dividends rather than “exempt-interest dividends” during the transitional phase. Funds whose investments are concentrated in a specific industry or sector may be subject to a higher degree of risk than funds whose investments are diversified and may not be suitable for all investors. Investments in bonds are subject to interest-rate risk and can lose principal value when interest rates rise, while they typically increase their principal values when interest rates decline. Bonds are also subject to credit risk, in which the bond issuer may fail to pay interest and principal in a timely manner, or that negative perception of the issuer’s ability to make such payments may cause the price of that bond to decline. The Fund may invest in high yield, fixed income securities that, at the time of purchase, are non-investment grade. High yield, lower rated securities involve greater price volatility and present greater risks than high rated fixed income securities. High yield securities are rated lower than investment-grade securities because there is a greater possibility that the issuer may be unable to make interest and principal payments on those securities. High yield securities involve greater risk than higher rated securities and portfolios that invest in them may be subject to greater levels of credit and liquidity risk than portfolios that do not. Municipal bonds are subject to credit risk, interest rate risk, liquidity risk and call risk. However, the obligations of some municipal issuers may not be enforceable through the exercise of traditional creditors’ rights. The reorganization under federal bankruptcy laws of a municipal bond issuer may result in the bonds being cancelled without payment or repaid only in part, or in delays in collecting principal and interest.
Definitions
Federal funds rate is the interest rate at which depository institutions (banks and credit unions) lend reserve balances to other depository institutions overnight on an uncollateralized basis. Exchange-traded funds (ETFs) are listed investment vehicles that seek to provide exposure to a benchmark, index or actively managed strategy.
A yield curve is a graphical representation of interest rates on debt of equal credit quality across a range of maturities. S&P Municipal Yield Index (Gross/Total) measures the performance of high yield and investment grade municipal bonds. A total-return index tracks price changes and reinvestment of distribution income. S&P Short Duration Municipal Yield Index (Gross/Total) measures the performance of high yield and investment grade municipal bonds with maturities of one to 12 years. A total-return index tracks price changes and reinvestment of distribution income. S&P Municipal Bond High Yield Index (Gross/Total) measures the performance of bonds in the S&P Municipal Bond Index that are not rated or whose ratings are below investment grade. A total-return index tracks price changes and reinvestment of distribution income. Bloomberg US Aggregate Bond Index (Gross/Total) measures the performance of the investment grade, US dollar-denominated, fixed-rate taxable bond market in the US, including Treasuries, government-related and corporate securities, fixed-rate agency MBS (agency fixed-rate and hybrid ARM passthroughs), ABS, and CMBS. A total-return index tracks price changes and reinvestment of distribution income.
Indexes are unmanaged and do not incur management fees or other operating expenses. One cannot invest directly in an index.
These holdings represent the top five contributors and detractors to performance for the First Eagle High Yield Municipal Fund as of 06/30/2026: Director of the St of Nevada Dept of Business & Industry Var-AMT-Sustainable-Brightline (25457VBV7) DesertXpress Enterprises LLC 1.22%; California Infrastructure & Economic Dev Bk Rev Var-AMT-Ref-Sustainable Bond-B (13034A7E4) DesertXpress Enterprises LLC 0.82%; New Hope Cultural Edu Facs Fin Corp TX Senior Living RevenueSenior Bonds-Sanctuary Ltc Pro (64542PGC3) Sanctuary LTC LLC 1.75%; Public Fin Auth WI Toll Revenue AMT-Senior-Georgia Sr 400 Expr (74448UAD0) SR 400 Peach Partners LLC 3.15%; Massachusetts St Dev Fin Agy Senior Living Revenue Care Communities Llc Obligated (57563WAC2) Care Communities LLC Obligated Group 0.63%; Florida St Dev Fin Corp AMT-Var-Ref-Brightline Florida (340618DK0) 0.94%; Florida St Dev Fin Corp Var-AMT-Brightline Passenger R (340618EB9) Brightline Florida Holdings, LLC 2.69%; Florida St Dev Fin Corp Var-AMT-Brightline FL Passenge (340618DY0) AAF Operations Holdings LLC 0.00%; Brightline East Llc (093536AA8) Brightline East LLC 0.03%; Buckeye OH Tobacco Settlement Fing Auth Cabs-Ref-Senior-Class 2-Ser B- (118217DA3) Buckeye Tobacco Settlement Financing Authority 0.00%.
Additional Disclosures
This commentary represents the opinion of the First Eagle Municipal Credit team as of the date noted. The opinions expressed are not necessarily those of the firm. These materials are provided for informational purposes only. These opinions are not intended to be a forecast of future events, a guarantee of future results or investment advice. Any statistics contained herein have been obtained from sources believed to be reliable, but the accuracy of this information cannot be guaranteed. The views expressed herein may change at any time subsequent to the date of issue hereof. The information provided is not to be construed as a recommendation or an offer to buy, hold or sell or the solicitation of an offer to buy or sell any fund or security.
The Fund’s portfolio is actively managed and holdings can change at any time. Current and future portfolio holdings are subject to risk.
The opinions expressed are not necessarily those of the firm. These materials are provided for informational purposes only. These opinions are not intended to be a forecast of future events, a guarantee of future results or investment advice. Any statistics contained herein have been obtained from sources believed to be reliable, but the accuracy of this information cannot be guaranteed. The views expressed herein may change at any time subsequent to the date of issue hereof.
Third-party marks are the property of their respective owners.
The information is not intended to provide and should not be relied on for accounting or tax advice. Any tax information presented is not intended to constitute an analysis of all tax considerations.
This document does not represent a solicitation of any order to buy or sell a security mentioned herein. Nothing here constitutes investment advice or insight as to the merits of any security or investment strategy mentioned herein.
FEF Distributors, LLC (“FEFD”) (SIPC), a limited purpose broker-dealer, distributes certain First Eagle products. FEFD does not provide services to any investor but rather provides services to its First Eagle affiliates. As such, when FEFD presents a fund, strategy or other product to a prospective investor, FEFD and its representatives do not determine whether an investment in the fund, strategy or other product is in the best interests of, or is otherwise beneficial or suitable for, the investor. No statement by FEFD should be construed as a recommendation. Investors should exercise their own judgment and/or consult with a financial professional to determine whether it is advisable for the investor to invest in any First Eagle fund, strategy or product.
Investors should consider investment objectives, risks, charges and expenses carefully before investing. The prospectus and summary prospectus contain this and other information about our funds and may be obtainedb y visiting our website at www.firsteagle.com or calling us at 800-334-2143. The prospectus or summary prospectus should be read carefully before investing.
First Eagle Funds are offered by FEF Distributors, LLC, a subsidiary of First Eagle Investment Management, LLC, which provides advisory services.