


Commentaries
Overseas Equity ETF Commentary
Overseas Equity ETF Commentary
Portfolio Review
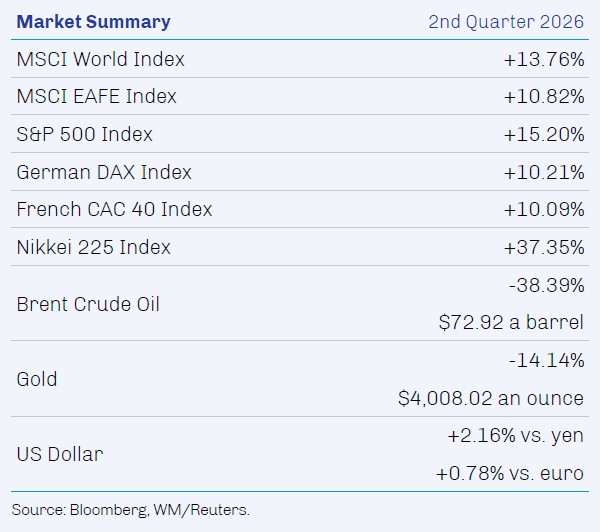
The Overseas Equity ETF posted a a return of7.11% in second quarter 2026. Emerging markets and developed Europe were the leading contributors while North America and developed Asia excluding Japan detracted. Information technology and consumer staples were the largest contributors among equity sectors, while energy, materials and communication services [MK1.1]detracted. The Overseas Equity ETF underperformed the MSCI EAFE Index in the period.
Leading contributors in the First Eagle Overseas Equity ETF this quarter included Samsung Electronics Co., Ltd., Merck KGaA, Compagnie Financière Richemont SA, Taiwan Semiconductor Manufacturing Co., Ltd. and FANUC Corporation.
Samsung Electronics is a global technology company and major manufacturer of diverse electronic components with a dominant presence in memory semiconductors. Shares performed well as strong pricing for both dynamic random-access memory (DRAM) and NAND memory chips underpinned earnings growth. Persistent demand from hyperscalers and long-term supply agreements underpin market expectations for sustained robust profitability.
Merck KGaA is a global life science, healthcare and electronics company based in Germany. Sales for the cancer drug Keytruda were strong during the quarter. Additionally, as the company announced its definitive agreement to acquire US life science tool company Bio-Techne, investors welcomed Merck’s shift away from midsize European pharma to instead focus on higher-quality, faster-growing, longer-duration franchises.
Shares of Swiss luxury goods company Richemont—with maisons that include Cartier and Van Cleef & Arpels—rallied on restored stability in the luxury goods market as hopes for reduced geopolitical tensions in Iran eased anxieties globally and alleviated pressure on the crucial Middle Eastern market. Strong jewelry sales, a solid cash position and resilient demand across the Americas and Europe contributed to returns.
Taiwan Semiconductor is the world’s largest semiconductor foundry, a primary manufacturer of advanced chips used in generative artificial intelligence for clients including Nvidia, Broadcom, Intel, Advanced Micro Devices and Apple. As the manufacturer of leading- edge products, shares of TSMC were strong during the quarter as continued soaring demand for AI semiconductors and high-performance computing were met by constrained supply and inelastic demand.
Based in Japan, FANUC is a global leader in computerized numerical control devices and robots. Reported earnings exceeded market expectations, reflecting double-digit growth in robotics and a major share buyback. Investor enthusiasm continues for FANUC’s collaboration with third-party large language models—including through partnerships with Nvidia and Google—to bring “physical AI” (i.e., converting language into robotic actions) into mainstream manufacturing. Opening its control system to outside plug-ins expands FANUC’s use cases by simplifying integration and programming for users.
The leading detractors in the quarter were Shell PLC, Imperial Oil Limited, Agnico Eagle Mines Limited, Jardine Matheson Holdings Limited and Wheaton Precious Metals Corp.
Shares of oil and gas supermajor Shell traded down alongside a decline in oil prices despite reporting better-than-expected earnings for its most recent quarter. Although one of the company’s key production facilities in Qatar was damaged by missile strikes, Shell’s geographically diverse liquefied natural gas portfolio provides flexibility to reroute cargo destinations from South America and Southeast Asia. We continue to like management’s commitment to returning cash to shareholders through dividends and buybacks.
Imperial Oil is a Canadian integrated oil company that is 70% owned by Exxon Mobil. Shares of Imperial Oil traded down alongside easing crude oil prices during the quarter. We continue to like the company’s low cash-production costs, network of centralized upstream reserves and integrated downstream refineries, and focus on returning cash to shareholders through stock buybacks.
Agnico Eagle is the world’s second-largest gold producer. Although the company reported record operational results for its most recent quarter, shares of Agnico traded down with gold bullion prices. We continue to like the company’s strong balance sheet, healthy pipeline of projects, cost-efficient operations and focus on returning cash to shareholders.
Headquartered in Hong Kong, holding company Jardine Matheson Holdings controls a diversified collection of business franchises predominantly across Greater China and Southeast Asia. The stock declined alongside other Singaporean property companies during the quarter. The company’s new chief executive announced a new investment strategy to improve capital allocation, grow earnings and return cash back to shareholders through dividends and buybacks. We like Jardine’s solid balance sheet, attractive assets and management’s focus on improving shareholder returns.
Shares of Wheaton, a Canadian streaming and royalty company, were pressured during the quarter by lower precious metals prices and margin contraction at partner mines. Wheaton benefits from operational expertise and a consistent track record of robust cash flow conversion. Longer term, Wheaton’s precious-metals streaming contract at the Antamina mine in Peru could prove transformational for the company. Wheaton’s growth potential is supported by its strong balance sheet and recent seamless leadership transition.
1. Source: FactSet; data as of June 30, 2026.
2. Source: FactSet; data as of June 30, 2026.
3. Source: Bloomberg, Federal Reserve, Goldman Sachs; data as of June 30, 2026.
4. Source: Federal Reserve; data as of March 31, 2026.
5. Source: Federal Reserve, Haver Analytics; data as of March 31, 2026.
6. Source: Bloomberg; data as of June 30, 2026.
7. Source: yCharts; data as of June 30, 2026.
8. Source: Bureau of Economic Analysis; data as of May 31, 2026.
9. Source: Reuters; data as of March 17, 2026.
10. Source: Bloomberg; data as of June 30, 2026.
11. Source: World Gold Council; data as of June 16, 2026.
12. Source: FactSet; data as of June 30, 2026.

The performance data quoted herein represent past performance and do not guarantee future results. Market volatility can dramatically impact the Fund’s short-term performance. Current performance may be lower or higher than figures shown. The investment return and principal value will fluctuate so that an investor’s shares, when redeemed, may be worth more or less than their original cost. Past performance data through the most recent month-end are available at www.firsteagle.com. Investments are not FDIC insured or bank guaranteed and may lose value.
1. Gross expense ratio is the total annual fund operating expenses before fee waivers.
2. The net expense ratio is the gross expense ratio after waivers and/or reimbursements.
First Eagle Investment Management, LLC (the “Adviser”) has contractually agreed to waive and/or reimburse certain fees and expenses so that the total annual fund operating expenses (excluding Acquired Fund Fees and Expenses (“AFFE”), brokerage commissions, extraordinary items, interest or taxes) (“annual operating expenses”) is limited to 0.50% of the Fund’s average daily net assets. These contractual limitations are in effect until 31-Dec-2026, and may not be terminated prior to that date without the approval of the Board of Trustees (the “Board”) of The RBB Fund Trust (the“Trust”).
Average annual returns are historical and reflect changes in share price, reinvested dividends and are net of expenses. Operating expenses reflect the Fund’s total annual operating expenses for the share class as of the Fund’s most current prospectus, including management fees and other expenses.
Investments are not FDIC insured or bank guaranteed and may lose value.
The annual expense ratio is based on expenses incurred by the Fund, as stated in the most recent prospectus.
Risks
All investments involve the risk of loss of principal.
Diversification does not guarantee investment returns and does not eliminate the risk of loss.
ETFs are subject to additional risks that do not apply to conventional mutual funds, including the risks that the market price of an ETF’s shares may trade at a premium or discount to its net asset value, an active secondary trading market may not develop or be maintained, or trading may be halted by the exchange in which they trade, which may impact an ETF’s ability to sell its shares. Shares of any ETF are bought and sold at market price (not NAV) and are not individually redeemed from the ETF. Brokerage commissions will reduce returns.
There are risks associated with investing in securities of foreign countries, such as erratic market conditions, economic and political instability and fluctuations in currency exchange rates. These risks may be more pronounced with respect to investments in emerging markets. A principal risk of investing in value stocks is that the price of the security may not approach its anticipated value or may decline in value. “Value” investments, as a category, or entire industries or sectors associated with such investments, may lose favor with investors as compared to those that are more “growth” oriented. Investment in gold and gold-related investments present certain risks, and returns on gold related investments have traditionally been more volatile than investments in broader equity or debt markets.
Definitions
Federal funds rate is the interest rate at which depository institutions (banks and credit unions) lend reserve balances to other depository institutions overnight on an uncollateralized basis. Gross domestic product (GDP) measures the total value of all economic output in goods and services for an economy.
MSCI World Index (Net) measures the performance of large and midcap equities across developed markets countries. A net-return index tracks price changes and reinvestment of distribution income net of withholding taxes. MSCI EAFE Index (Net) measures the performance of large and midcap equities across developed markets countries around the world excluding the US and Canada. A net-return index tracks price changes and reinvestment of distribution income net of withholding taxes. MSCI World Growth Index (Net) measures the performance of large and midcap equities exhibiting overall growth style characteristics across developed markets. Growth investment style characteristics are defined using long-term forward EPS growth rate, short-term forward EPS growth rate, current internal growth rate, long-term historical EPS growth trend, and long-term historical sales per share growth trend. A net-return index tracks price changes and reinvestment of distribution income net of withholding taxes. S&P 500 Index (Gross/Total) measures the performance of 500 of the top companies in the leading industries of the US economy and is widely recognized as a proxy for the US market as a whole. A total-return index tracks price changes and reinvestment of distribution income. Nikkei 225 is a price-weighted index composed of 225 stocks in the Prime Market of the Tokyo Stock Exchange. It is widely recognized as a proxy for the Japanese equity market as a whole. German DAX® Index measures the performance of the 40 largest companies listed on the Frankfurt Stock Exchange that fulfil certain minimum quality and profitability requirements. It is widely recognized as a proxy for the German equity market as a whole. CAC 40® Index is a free-float market capitalization-weighted index that measures the performance of the 40 largest and most actively traded shares listed on Euronext Paris.
Indexes are unmanaged and do not incur management fees or other operating expenses. One cannot invest directly in an index.
These holdings represent the top five contributors and detractors to performance for the First Eagle Overseas Equity ETF as of 06/30/2026: Samsung Electronics Co., Ltd. 4.70%; Merck KGaA 2.69%; Compagnie Financière Richemont SA 2.55%; Taiwan Semiconductor Manufacturing Co., Ltd. 1.94%; FANUC Corporation 1.65%; Shell PLC 3.77%; Imperial Oil Limited 2.85%; Agnico Eagle Mines Limited 0.96%; Jardine Matheson Holdings Limited 1.60%; Wheaton Precious Metals Corp 1.39%.
Additional Disclosures
This commentary represents the opinion of the Global Value team as of the date noted. The opinions expressed are not necessarily those of the firm. These materials are provided for informational purposes only. These opinions are not intended to be a forecast of future events, a guarantee of future results or investment advice. Any statistics contained herein have been obtained from sources believed to be reliable, but the accuracy of this information cannot be guaranteed. The views expressed herein may change at any time subsequent to the date of issue hereof. The information provided is not to be construed as a recommendation to buy, hold or sell or the solicitation or an offer to buy or sell any fund or security.
The Fund’s portfolio is actively managed and holdings can change at any time. Current and future portfolio holdings are subject to risk. The investment process may change over time. The information set forth above is intended as a general illustration of some of the criteria the investment team considers in selecting securities. Not all investments will meet such criteria.
The opinions expressed are not necessarily those of the firm. These materials are provided for informational purposes only. These opinions are not intended to be a forecast of future events, a guarantee of future results or investment advice. Any statistics contained herein have been obtained from sources believed to be reliable, but the accuracy of this information cannot be guaranteed. The views expressed herein may change at any time subsequent to the date of issue hereof.
Third-party marks are the property of their respective owners.
As with all ETFs, shares may be bought and sold in the secondary market at market prices. Investments involve risk. Principal loss is possible.
Investors should consider investment objectives, risks, charges and expenses carefully before investing. The prospectus and summary prospectus contain this and other information about our funds and may be obtained by visiting our website at www.firsteagle.com or calling us at 800-334-2143. The prospectus or summary prospectus should be read carefully before investing.
First Eagle ETFs are distributed by Quasar Distributors, LLC.
©2026 First Eagle Investment Management, LLC. All rights reserved.