BLOGThe Bird's Eye View
Timely Perspectives, Unconventional Thinking
We’re excited to share timely market insights, thoughtful perspectives and expert commentary as part of our commitment to providing modern investment solutions to modern challenges.
BLOGThe Bird's Eye View
Timely Perspectives, Unconventional Thinking
We’re excited to share timely market insights, thoughtful perspectives and expert commentary as part of our commitment to providing modern investment solutions to modern challenges.

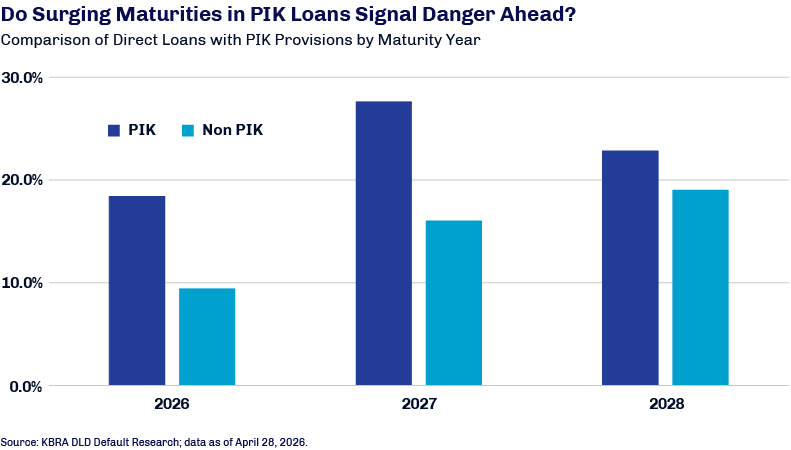
The surging wall of maturities for payment-in-kind (PIK) loans, as shown in the chart below, may signal turbulence ahead. While not always indicative of distress, loans with PIK terms—which allow borrowers to add accrued interest to a loan’s principal balance rather than paying it in cash—generally have higher default rates and carry higher risk compared to traditional cash-pay loans.1
Although reflective of a borrower’s desire to conserve cash, not all PIK loans are created equal. When included as an option at the time of a loan’s origination, PIK provisions may provide an effective tool for sound businesses to reinvest cash back into operations. Anticipating the possibility of interest payment in kind rather than cash, lenders can price the loan for greater risk upfront.
When appended to original deal terms for a borrower struggling to meet cash obligations, however, PIK amendments often signal potential impairment on the horizon. Unpaid interest expands the debt load and thus the leverage for an already cash-strapped borrower, which can significantly increase the probability of default on the loan and ultimately loss to the lender.
While PIK can sometimes staunch defaults in the near term, it often proves ineffective over the long run. The default rate for loans with appended PIK provisions can be 10 times higher than for traditional cash-pay loans and recoveries tend to trail cash loans (by about 1,000 basis points over the last two years, for example).2 Further, the non-cash income received by lenders can strain liquidity for investors. This liquidity strain may thwart exit opportunities—through refinancing or sale of the company—due to increased leverage and higher loan-to-value ratios.

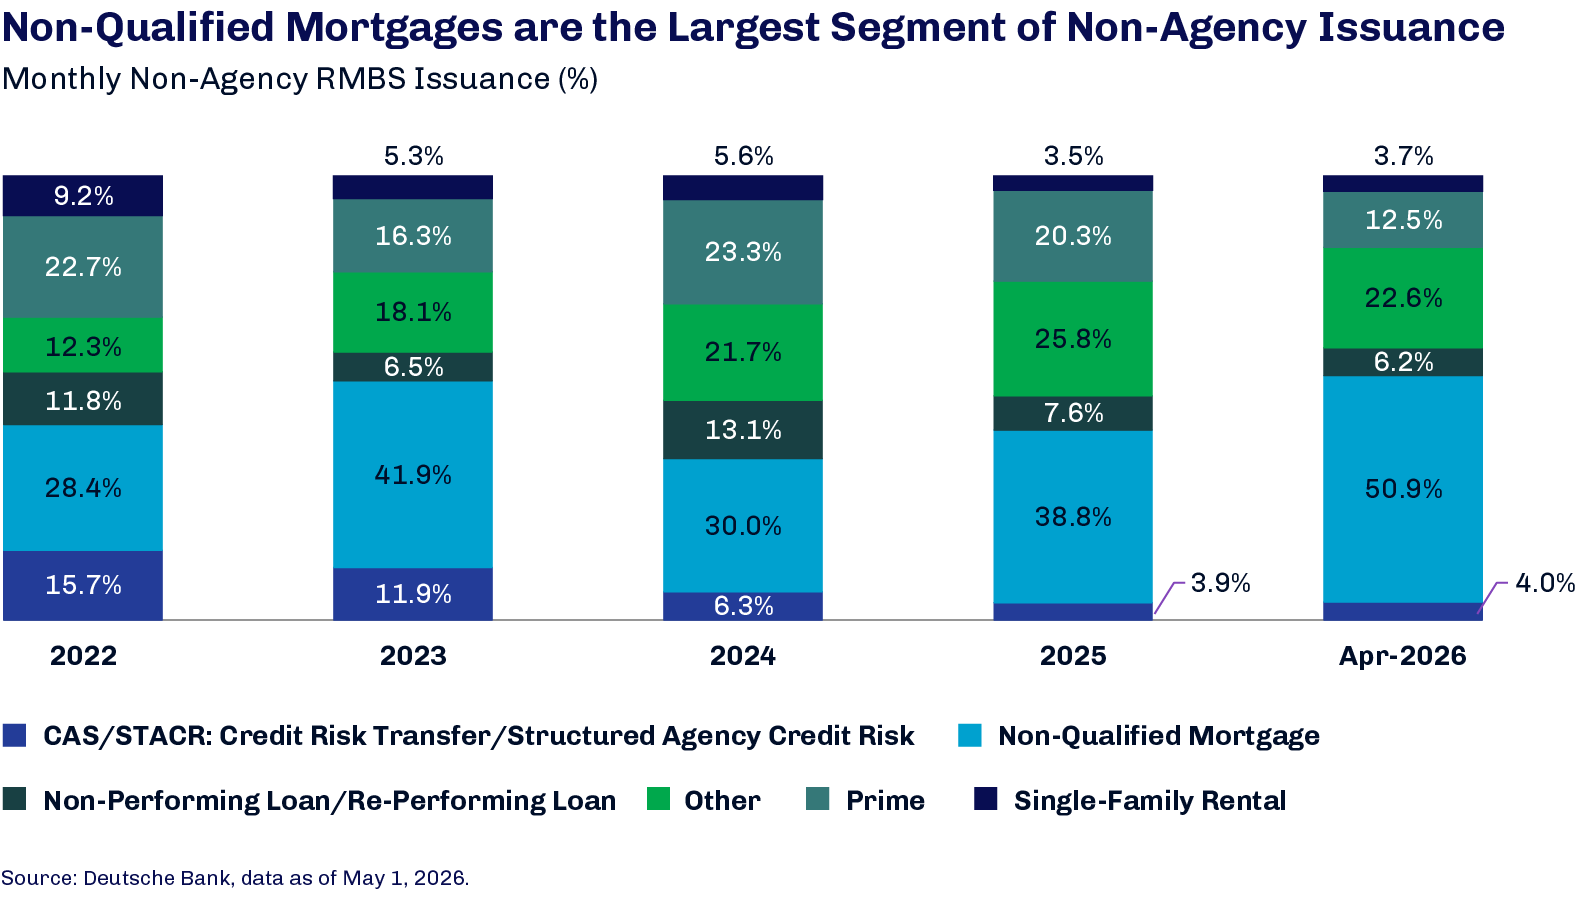
Nonconforming mortgages are those that do not meet the underwriting standards of government-sponsored enterprises (GSEs) like Fannie Mae and Freddie Mac. While the size of the loan is the most common reason, there are a number of borrower-, property- and structure-specific factors that can push a mortgage into this bucket. Nonconforming loans are generally considered riskier for lenders and thus tend to carry higher interest rates than conforming loans.
Nonconforming mortgage originations (excluding jumbo loans) as a share of all mortgages has doubled over the past three years to reach levels not seen since the 2000s housing crash.1 To help deepen the pool of US consumers eligible for more economical conforming mortgages in the face of pent-up housing demand, the Federal Housing Finance Agency in April expanded underwriting standards for the GSEs to include their first new credit score models in decades: VantageScore 4.0 and FICO Score 10T.
Incorporating additional consumer data like rent-payment history, these models are expected to provide a more complete view of a borrower’s creditworthiness. The GSEs began accepting VantageScore 4.0 through a limited rollout to approved lenders in late April, and FICO Score 10T is expected to be implemented in the coming months. Classic Fair Issac Corporation (FICO) scores will continue to be accepted as the GSEs transition.2
The share of alternative loans is a small portion of the overall market, but non-qualified mortgages—a cohort that includes a large portion of non-jumbo nonconforming mortgages—have historically been the largest segment of issuance within the non-agency residential mortgage-backed security space. Adoption of these new credit score systems appears to be happening faster than expected and may create refinancing incentives for borrowers, which we believe could weigh on conventional low FICO-specified asset pools. That said, the limited scope of the initial rollout may mitigate the near-term impact.3