Source: FactSet, data as of October 30, 2025.
Source: Bloomberg; data as of October 31, 2025.
The information contained in this material is provided by First Eagle Investment Management, LLC (“FEIM”) and its global subsidiaries (collectively, “First Eagle”). FEIM is an investment adviser registered with the U.S. Securities and Exchange Commission (SEC). Registration with the SEC does not imply a certain level of skill or training.
This material is for informational purposes only and reflect prevailing conditions and the judgment of the author(s) as of the date of publication, all of which are subject to change. This material should not be relied upon as investment advice; it does not constitute a recommendation to buy or sell a security or other investment; and it is not intended to predict or depict the performance of any investment. This material is not being provided in a fiduciary capacity and is not intended to recommend any investment policy or investment strategy or consider the specific objectives or circumstances of any investor. We consider the information in this material to be accurate, but we do not represent that it is complete or should be relied upon as the sole source of appropriateness for investment.
Prospective investors should inform themselves and consult with an investment, tax or legal professional as to any applicable legal requirements, taxation and exchange control regulations in the countries of their citizenship, residence or domicile that may be relevant prior to investing.
THIS MATERIAL DOES NOT CONSTITUTE AN OFFER OR SOLICITATION IN ANY JURISDICTION WHERE OR TO ANY PERSON TO WHOM IT WOULD BE UNAUTHORIZED OR UNLAWFUL TO DO SO.
All investments involve the risk of loss of principal.
Past performance does not guarantee future results, which may vary. The value of investments and the income derived from investments will fluctuate and can go down as well as up. A loss of principal may occur.
Indexes are unmanaged and do not incur management fees or other operating expenses. One cannot invest directly in an index.
A principal risk of investing in value stocks is that the price of the security may not approach its anticipated value or may decline in value. “Value” investments, as a category, or entire industries or sectors associated with such investments, may lose favor with investors as compared to those that are more “growth” oriented.
There are risks associated with investing in foreign investments (including depositary receipts). Foreign investments, which can be denominated in foreign currencies, are susceptible to less politically, economically and socially stable environments; fluctuations in the value of foreign currency and exchange rates; and adverse changes to government regulations.
Diversification does not guarantee investment returns and does not eliminate the risk of loss.
Indices are unmanaged and do not incur management fees or other operating expenses. One cannot invest directly in an index.
MSCI EAFE Index (Net) measures the performance of large and midcap equities across developed markets countries around the world excluding the US and Canada. A net-return index tracks price changes and reinvestment of distribution income net of withholding taxes.
S&P 500 Index (Gross/Total) measures the performance of 500 of the top companies in the leading industries of the US economy and is widely recognized as a proxy for the US market as a whole. A total-return index tracks price changes and reinvestment of distribution income.
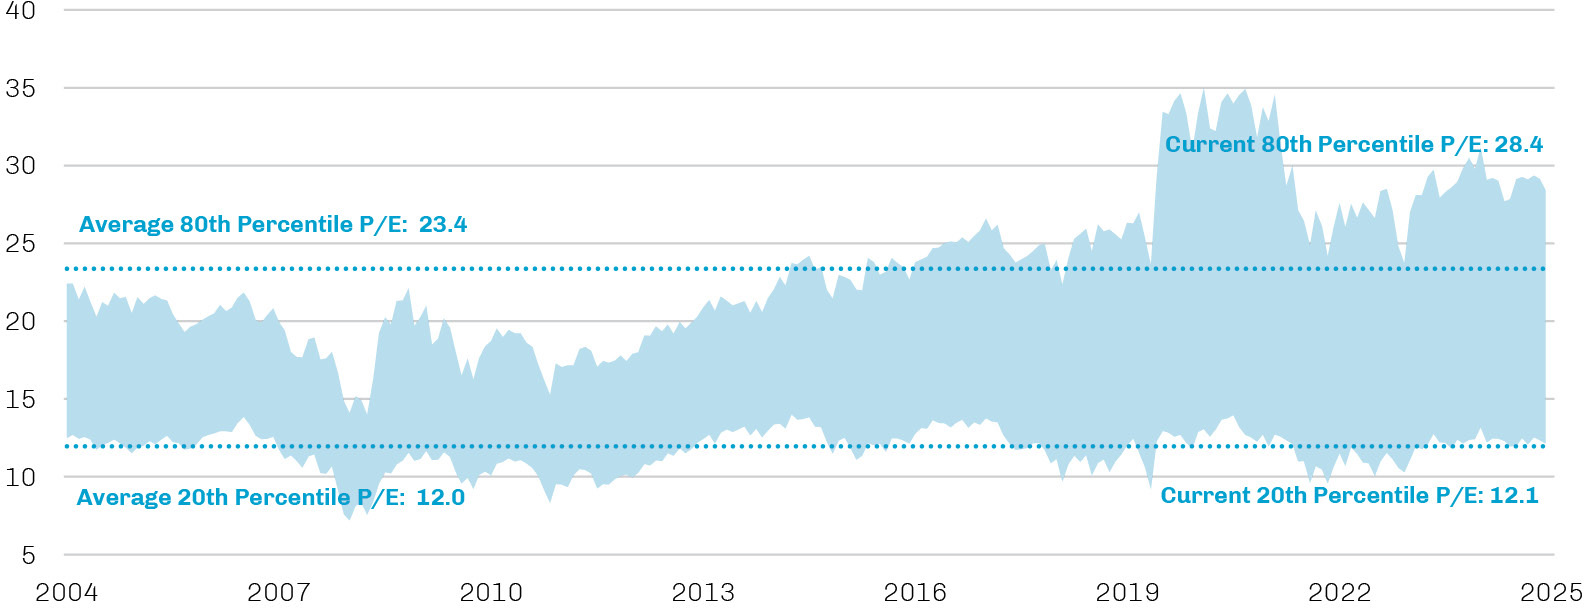
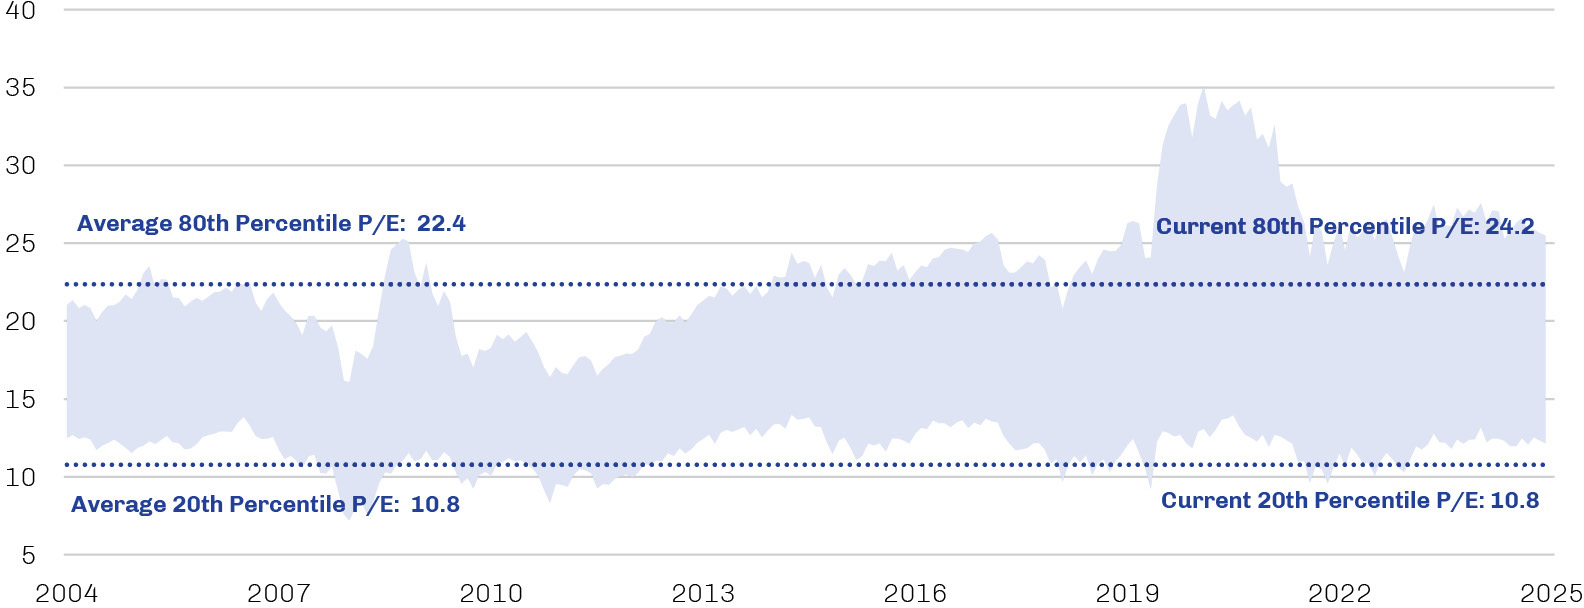
Price-to-Earnings Ratio (P/E ratio) compares a company’s stock price to its earnings per share.
The information presented does not reflect the performance of any fund, strategy or account managed or serviced by First Eagle, and there is no guarantee that investors will experience the type of performance reflected. There is no guarantee that any market forecast set forth in this video will be realized. There is no guarantee that any historical trend referenced herein will be repeated in the future, and there is no way to predict precisely when such a trend will begin. The mention of specific securities is not a recommendation or solicitation to buy, sell or hold any particular security and should not be relied upon as investment advice.
Availability of the products or services described may be restricted by law in certain jurisdictions. This material may not be distributed, published or used by any person or entity in any jurisdiction or country where such distribution or use would be contrary to local law or regulation.
United Kingdom
First Eagle Investment Management Ltd is authorized and regulated by the Financial Conduct Authority (FRN: 798029).
Middle East
This material is for information purposes only and has not been, and will not be, registered with or reviewed or approved by any regulator located in the Middle East. It does not constitute or form part of any marketing initiative, any offer to issue or sell, or any solicitation of any offer to subscribe to or purchase, any products, strategies or other services, nor shall it, or the fact of its distribution, form the basis of, or be relied on in connection with, any contract resulting therefrom. In the event that the recipient of this material wishes to receive further information regarding any products, strategies or other services, it shall specifically request the same in writing from an authorized financial adviser.
Canada
Pursuant to the international adviser registration exemption in National Instrument 31-103, First Eagle Investment Management, LLC. is informing you that: (i) First Eagle Investment Management, LLC. is not registered in Canada and is advising you in reliance upon an exemption from the adviser registration under National Instrument 31-103; (ii) First Eagle Investment Management, LLC’s jurisdiction of residence is New York, USA; (iii) there may be difficulty enforcing legal rights against First Eagle Investment Management, LLC. because it is a resident outside of Canada and all or substantially all of its assets may be situated outside of Canada.
FEF Distributors, LLC (“FEFD”) (SIPC), a limited purpose broker-dealer, distributes certain First Eagle products. FEFD does not provide services to any investor but rather provides services to its First Eagle affiliates. As such, when FEFD presents a fund, strategy or other product to a prospective investor, FEFD and its representatives do not determine whether an investment in the fund, strategy or other product is in the best interests of, or is otherwise beneficial or suitable for, the investor. No statement by FEFD should be construed as a recommendation. Investors should exercise their own judgment and/or consult with a financial professional to determine whether it is advisable for the investor to invest in any First Eagle fund, strategy or product.
First Eagle Investments is the brand name for First Eagle Investment Management, LLC and its subsidiary investment advisers.
©2026 First Eagle Investments. All rights reserved.