Value as a Philosophy

Value as a Philosophy


Drawing on a large body of groundbreaking work—including that of such luminaries as Graham, Buffett and Eveillard, as well as thinkers further afield—the Global Value team’s value-oriented investment philosophy is rooted in the belief that the greatest risk investors face is not day-to-day market volatility but rather the permanent impairment of capital, the primary cause of which is overpaying for assets.

As discussed below, the Global Value team takes an atypical approach in its efforts to avoid this hazard when selecting stocks—one that promotes the idea of “value” as a big tent rather than an artificial constraint and in doing so captures the ongoing structural shift toward a knowledge-based economy heavily reliant on intangible assets.

The Importance of Character
Rather than dogmatically limiting our universe to only the cheapest group of stocks by some statistical measure, the Global Value team lets the character of a business dictate its potential appeal as an investment. By avoiding the assumption of business homogeneity that is inherent in index-based approaches to value, either passive or benchmarked, the quantification of price becomes conditional to a comprehensive appraisal of a business’s specific tangible and intangible attributes—and the value opportunity set becomes much broader in the process.

Specifically, we look for companies we believe have the potential for persistent earnings power by virtue of possessing a scarce, durable asset—a tangible or intangible factor that in our view provides it with a long-term operational advantage and is highly difficult to replicate. Companies with scarce assets are not immune from the impact of business cycles, but their persistent free cash flow generation may provide a cushion against economic downturns while also creating opportunities to potentially enhance their competitive position against less-resilient businesses.

Long the basis for fundamental security analysis, tangible assets are fairly straightforward. We seek companies with physical resources that are well located relative to their competition—as manifest in the ability either to have consistently generated strong revenues or kept costs low—and that have a long natural duration; that is to say, assets we expect to earn a spread relative to the average asset in the same industry. Take real estate, for example. Office space in a prime business district is likely to command higher rent than comparable space in other locations while also appreciating at a higher rate. Natural resources like oil fields are an example of scarce assets at the other end of the tangible spectrum. Typically removed from population centers, oil fields’ benefits are derived from their production and cost characteristics. Properties with high levels of proved and provable reserves, low operating and capital costs, and long forecasted lives will most likely be more profitable over time and generate cash flows less sensitive to fluctuations in the price of the underlying commodity.

While tangible assets are fairly intuitive, intangible assets—which have been growing steadily in prominence— require a more nuanced evaluation approach. The Global Value team has devoted significant time and resources refining our understanding of these assets and their impact on a business’s intrinsic value.1 We believe the analysis of a company’s intangible assets can be oriented around two broad, interrelated concepts: the incumbency of its market position and the quality of its management.

An incumbent market position may be the most valuable intangible asset, as it has the potential to be self-reinforcing.2 A dominant player in its space—whether it’s kitchen equipment or computer software—can be difficult to unseat. These companies are entrenched in their industries and possess unique expertise, and their size enables them to scale fixed costs across a larger production volume and potentially generate attractive free cash flows as a result. This cash can then be used to augment their already advantaged position in a concentric manner—or to put it in Buffetian terms, to expand the moat around their business. Investments in research and development can drive better product-quality mix and improved average pricing, for example, while advertising spending can enhance a company’s brand and attract a broader customer base.

As it does with tangible assets, the duration of intangible assets matters greatly to us. Just as we’d prefer a gold mine with 20 years of proved high-grade reserves over a mine with three, companies whose intangible assets have the potential to endure—evident in strong customer retention and renewal rates, stable market shares and consistent cash flows, as well as high barriers to entry that deter new competitors—are more valuable than those that may be fleeting.

While the consistency of cash flow generation over time provides a sightline into the strength and duration of a company’s advantaged assets, its use of this cash can serve as a yardstick for management acumen. In our view, quality management teams act like owners, conducting the balance sheet in ways that are likely to help the business incrementally expand over time without risking its scarcity advantages. These teams maintain prudent levels of leverage, focus organic investment on areas of competitive advantage, generate favorable returns on capital deployed inorganically through mergers and acquisitions, and regularly return capital to shareholders in the form of dividends and/or share buybacks. Such a management style—which we find to be prevalent in companies whose senior management team holds significant equity or that are run by founders or families— tends to be focused less on quarter-to-quarter metrics and more on the creation of long-term shareholder value, an approach well aligned with our investment horizon.

Distinguishing Value from Valuation 
Once we’ve identified what we believe to be a well-positioned, well-capitalized, well-managed company, we invest in it only when we can do so at a meaningful “margin of safety,” which we define as the difference between a company’s market price and our estimate of its intrinsic value. The “margin of safety” we demand is idiosyncratic to each company, a function of the scarcity and duration we see in it considering both its tangible and intangible assets.

The exhibit below is a stylized representation of how we view the relationship between a company’s persistence and its intrinsic value. On the right side of the chart are found the most rare and potentially most profitable investments—those with the advantage of scarce assets currently generating strong earnings and the ability to preserve or expand that advantage by leveraging the value of their franchise. Though equity market valuations of such companies will fluctuate over time, their intrinsic value tends to drift higher in conjunction with the expansion of the global economy as the company maintains or grows its share of what has become a larger whole.

Intangible Assets Contribute to Intrinsic Value

Reflections - Exhibit 9


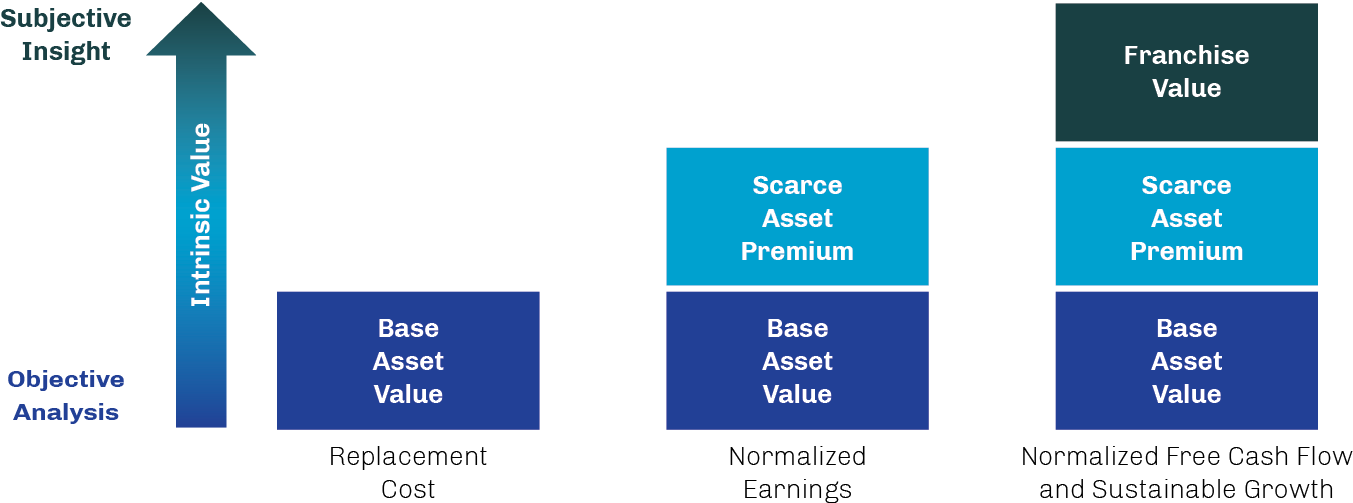
Source: First Eagle Investments; as of November 30, 2022.

Within this category we often find stocks rich in intangible assets. Unlike our typical benchmarked peers, First Eagle’s value-oriented investment philosophy welcomes growth—but only growth that creates, in our view, intrinsic value. This is an important distinction in our minds, and one that is far too often overlooked in markets that appear to prize a company’s potential above all else. To create intrinsic value, the return on capital invested in a growth initiative must exceed the cost of that capital. A company can generate growth in a broad sense—in revenue, assets or operating income, for example—while at the same time destroying value due to the cost of that growth. While this idea may sound fairly basic on the surface, history demonstrates that value-creating growth opportunities are difficult for companies to identify and to execute successfully. History also demonstrates that investors at times have been willing to support outsized valuation multiples for companies deemed to have great promise, only to be disappointed when it was never fully realized.

We have found that companies are more likely to deliver value-creating growth by investing in areas where they have an existing competitive advantage or there exist barriers to entry; while the former produce high current returns on capital, the latter help insulate these returns from the deleterious impact of competition in the future.3 These criteria are no silver bullet, however, and even a small overestimation of a growth initiative’s potential contribution can have a large impact on the intrinsic value ultimately created—and thus on the attractiveness of the investment opportunity.

Consistent Temperament in an Uncertain World
Accepting that our crystal ball is foggy at best, a healthy respect for risk has been integral to the evolution of the Global Value team’s investment process over the years. The periodic emergence of unforeseen events—such as the Covid-19 outbreak in 2020 and the Russian invasion of Ukraine in 2022—has served as a reminder that most professional investors tend to view risk through the lens of backward-looking quantifiable models that have normal outcome distributions, with less consideration of the freeform ambiguity that represents the true “risk” of investing.

This uncertainty drives our efforts to understand the worst-case scenario for every stock we consider for investment. The end result is not an assortment of “best ideas” but, rather, a curated collection of businesses that in our view not only appear well positioned to generate persistent cash flows over the long term but also have the capacity to suffer through short-term challenges, acquired at a price we believe offers a sufficient “margin of safety.” Further, our process is biased toward broad diversification and incremental conservatism in the size of our holdings.

The distinct temperament of our investment professionals is key to the success of our process. The team must have the patience to wait for opportunities that meet our criteria to emerge and be willing to accept that they may never do so. Humility, too, is essential; accepting that we cannot see the future drives our insistence on having a “margin of safety” in our purchase prices. Finally, flexibility allows us to execute our investment process free from the limitations of benchmarks and ensures that capital allocation decisions are driven only by the conviction of our beliefs.

1. “Intrinsic value” is based on the Global Value team’s judgement of what a prudent and rational business buyer would pay in cash for all of
a company in normal markets.
2. On the subject of incumbency, we’re indebted to Bruce Greenwald—well-known authority on value investing, recently retired academic director of the Heilbrunn Center for Graham & Dodd Investing at Columbia Business School, and a senior advisor to the Global Value team since 2011 after serving as our director of research—whose work has illuminated our thinking.
3. Bruce Greenwald, Judd Kahn, Erin Bellissimo, Mark A. Cooper and Tano Santos, Value Investing: From Graham to Buffett and Beyond,
John Wiley & Sons (2021).


The opinions expressed are not necessarily those of the firm and are subject to change based on market and other conditions. These materials are provided for informational purposes only. These opinions are not intended to be a forecast of future events, a guarantee of future results, or investment advice. Any statistics contained herein have been obtained from sources believed to be reliable, but the accuracy of this information cannot be guaranteed. The views expressed herein may change at any time subsequent to the date of issue hereof. The information provided is not to be construed as a recommendation or an offer to buy or sell or the solicitation of an offer to buy or sell any security. Past performance does not guarantee future results.

Risk Disclosures

All investments involve the risk of loss of principal.

The value and liquidity of portfolio holdings may fluctuate in response to events specific to the companies or markets, as well as economic, political or social events in the United States or abroad. During periods of market volatility, the value of individual securities and other investments at times may decline significantly and rapidly. The securities of small companies can be more volatile in price than those of larger companies and may be more difficult or expensive to trade.

A principal risk of investing in value stocks is that the price of the security may not approach its anticipated value or may decline in value. “Value” investments, as a category, or entire industries or sectors associated with such investments, may lose favor with investors as compared to those that are more “growth” oriented..

There are risks associated with investing in foreign investments (including depositary receipts). Foreign investments, which can be denominated in foreign currencies, are susceptible to less politically, economically and socially stable environments; fluctuations in the value of foreign currency and exchange rates; and adverse changes to government regulations.

Investment in gold and gold-related investments present certain risks, including political and economic risks affecting the price of gold and other precious metals, like changes in US or foreign tax, currency or mining laws, increased environmental costs, international monetary and political policies, economic conditions within an individual country, trade imbalances, and trade or currency restrictions between countries. The price of gold, in turn, is likely to affect the market prices of securities of companies mining or processing gold and, accordingly, the value of investments in such securities may also be affected. Gold-related investments as a group have not performed as well as the stock market in general during periods when the US dollar is strong, inflation is low and general economic conditions are stable. In addition, returns on gold-related investments have traditionally been more volatile than investments in broader equity or debt markets. Investment in gold and gold-related investments may be speculative and may be subject to greater price volatility than investments in other assets and types of companies.

Strategies whose investments are concentrated in a specific industry or sector may be subject to a higher degree of risk than funds whose investments are diversified and may not be suitable for all investors.

Diversification does not guarantee investment returns and does not eliminate the risk of loss.

Portfolio holdings are subject to change and should not be considered a recommendation to buy, hold or sell securities. Current and future portfolio holdings are subject to risk.

Alternative investments can be speculative and are not suitable for all investors. Investing in alternative investments is only intended for experienced and sophisticated investors who are willing and able to bear the high economic risks associated with such an investment. Investors should carefully review and consider potential risks before investing. Certain of these risks include:

  • Loss of all or a substantial portion of the investment;

  • Lack of liquidity in that there may be no secondary market or interest in the strategy and none is expected to develop;

  • Volatility of returns;

  • Interest rate risk;

  • Restrictions on transferring interests in a private investment strategy;

  • Potential lack of diversification and resulting higher risk due to concentration within one of more sectors, industries, countries or regions;

  • Absence of information regarding valuations and pricing;

  • Complex tax structures and delays in tax reporting;

  • Less regulation and higher fees than mutual funds;

  • Use of leverage, which magnifies the potential for gain or loss on amounts invested and is generally considered a speculative investment technique and increases the risks associated with investing in the strategy;

  • Carried interest, which may cause the strategy to make more speculative, higher-risk investments than would be the case in absence of such arrangements; and

  • Below-investment grade loans, which may default and adversely affect returns.

Active management is an investment management approach in which an investor, a professional money manager or a team of professionals tracks the performance of an investment portfolio and makes buy, hold, and sell decisions about the assets in it.

Asset-backed securities (ABS) are financial instruments collateralized by a pool of assets, such as mortgages, credit-card receivables, auto loans and student loans.

Bear market is generally defined as a period during which a market experiences a prolonged decline in price.

Bottom-up investing primarily considers factors affecting individual companies and secondarily focuses on industries and economic trends.

Bull market is generally defined as a period during which a market experiences a prolonged increase in price.

Collateralized loan obligations (CLOs) are financial instruments collateralized by a pool of corporate loans.

Consumer price index (CPI) is a measure of the average change over time in prices paid by consumers for a specific basket of goods and services. The core version of this index excludes more volatile food and energy prices.

Consumer price index (CPI) is a measure of the average change over time in prices paid by consumers for a specific basket of goods and services. The core version of this index excludes more volatile food and energy prices.

Diversification is a strategy that involves allocating assets to a variety of investments with the intention to help manage risk.

Federal funds rate is the interest rate at which depository institutions (banks and credit unions) lend reserve balances to other depository institutions overnight on an uncollateralized basis.

Floating-rate securities are financial instruments whose interest rate is adjusted periodically based on movements in an underlying reference rate.

Intrinsic value is based on a judgment of what a prudent and rational business buyer would pay in cash for all of a company in normal markets.

Margin of safety is defined by First Eagle as the difference between a company’s market value and our estimate of its intrinsic value. An investment made with a margin of safety is no guarantee against loss.

Mortgage-backed securities (MBS) are financial instruments collateralized by a pool of mortgages.

Passive Management is an investment management approach that seeks to mirror the performance of a designated index.

Special-purpose acquisition company (SPACs) are publicly listed entities formed solely to acquire one or more privately held companies.

Target-date funds are packaged asset-allocation products whose investment allocation shifts over time as their target date nears.

Treasury inflation-protected securities (TIPS) are a type of US Treasury issuance whose principal value is indexed to the rate of inflation.

Volatility is a statistical measure of the degree to which the return of a portfolio or individual security deviates from its mean over time. Indexes are unmanaged, and one cannot invest directly in an index.

Equity Indexes

MSCI EAFE Index measures the performance of large and midcap securities across 21 developed markets countries around the world excluding the US and Canada.

MSCI EAFE Growth Index measures the performance of large and midcap securities exhibiting overall growth style characteristics across developed markets countries around the world excluding the US and Canada. The growth investment style characteristics for index construction are defined using five variables: long-term forward EPS growth rate, short-term forward EPS growth rate, current internal growth rate, long-term historical EPS growth trend, and long-term historical sales per share growth trend.

MSCI EAFE Value Index measures the performance of large and midcap securities exhibiting overall value style characteristics across developed markets countries around the world excluding the US and Canada. The value investment style characteristics for index construction are defined using three variables: book value to price, 12-month forward earnings to price, and dividend yield.

MSCI EAFE Mid-Cap Index measures the performance of midcap securities across developed markets countries around the world excluding the US and Canada.

MSCI EAFE Mid-Cap Growth Index measures the performance of midcap securities exhibiting overall growth style characteristics across developed markets countries around the world excluding the US and Canada. The growth investment style characteristics for index construction are defined using five variables: long-term forward EPS growth rate, short-term forward EPS growth rate, current internal growth rate, long-term historical EPS growth trend, and long-term historical sales per share growth trend.

MSCI EAFE Mid-Cap Value Index measures the performance of midcap securities exhibiting overall value style characteristics across developed markets countries around the world excluding the US and Canada. The value investment style characteristics for index construction are defined using three variables: book value to price, 12-month forward earnings to price, and dividend yield.

MSCI Emerging Markets Index measures the performance of large and midcap representation across 21 emerging markets countries around the world.

MSCI EAFE Small Cap Index measures the performance of small cap representation across developed markets countries around the world excluding the US and Canada.

MSCI EAFE Small Cap Growth Index measures the performance of small cap securities exhibiting overall growth style characteristics across developed markets countries around the world excluding the US and Canada. The growth investment style characteristics for index construction are defined using five variables: long-term forward EPS growth rate, short-term forward EPS growth rate, current internal growth rate, long-term historical EPS growth trend, and long-term historical sales per share growth trend.

MSCI EAFE Small Cap Value Index measures the performance of small cap securities exhibiting overall value style characteristics across developed markets countries around the world excluding the US and Canada. The value investment style characteristics for index construction are defined using three variables: book value to price, 12-month forward earnings to price, and dividend yield.

MSCI World Index measures the performance of large and midcap securities across 23 developed markets countries around the world.

MSCI World Growth Index measures the performance of large and midcap securities exhibiting growth style characteristics across 23 developed markets countries. The growth investment style characteristics for index construction are defined using five variables: long-term forward EPS growth rate, short-term forward EPS growth rate, current internal growth rate, long-term historical EPS growth trend, and long-term historical sales per share growth trend.

MSCI World Value Index measures the performance of large and midcap securities exhibiting value style characteristics across 23 developed markets countries. The value investment style characteristics for index construction are defined using three variables: book value to price, 12-month forward earnings to price, and dividend yield.

Russell 1000® Index measures the performance of the large cap segment of the US equity universe. It is a subset of the Russell 3000® Index and includes approximately 1,000 of the largest securities based on a combination of their market cap and current index membership.

Russell 1000® Growth Index measures the performance of the large cap growth segment of the US equity universe. It includes those Russell 1000 companies with relatively higher price-to-book ratios, higher I/B/E/S forecast medium-term (two-year) growth, and higher sales per share historical growth (five years).

Russell 1000® Value Index measures the performance of the large cap value segment of the US equity universe. It includes those Russell 1000 companies with relatively lower price-to-book ratios, lower I/B/E/S forecast medium-term (two-year) growth, and lower sales per share historical growth (five years).

Russell 2000® Index measures the performance of the small cap segment of the US equity universe. It includes approximately 2,000 of the smallest securities based on a combination of their market cap and current index membership.

Russell 2000® Growth Index measures the performance of the small cap growth segment of the US equity universe. It includes those Russell 2000 companies with relatively higher price-to-book ratios, higher I/B/E/S forecast medium-term (two-year) growth, and higher sales per share historical growth (five years). 

Russell 2000® Value Index measures the performance of the small cap value segment of the US equity universe. It includes those Russell 2000 companies with relatively lower price-to-book ratios, lower I/B/E/S forecast medium-term (two-year) growth, and lower sales per share historical growth (five years).

Russell Midcap® Index measures the performance of the midcap segment of the US equity universe. It is a subset of the Russell 1000® Index and includes approximately 800 of the smallest securities based on a combination of their market cap and current index membership.

Russell Midcap® Growth Index measures the performance of the midcap growth segment of the US equity universe. It includes those Russell Midcap Index companies with relatively higher price-to-book ratios, higher I/B/E/S forecast medium-term (two-year) growth,and higher sales per share historical growth (five years).

Russell Midcap® Value Index measures the performance of the midcap segment of the US equity universe. It includes those Russell Midcap Index companies with relatively lower price-to-book ratios, lower I/B/E/S forecast medium-term (two-year) growth, and lower sales per share historical growth (five years).

S&P 500 Index is a widely recognized unmanaged index including a representative sample of 500 leading companies in leading sectors of the US economy. Although the S&P 500 Index focuses on the large cap segment of the market, with approximately 80% coverage of US equities, it is also considered a proxy for the total market.

Fixed Income Indexes
Bloomberg Global Aggregate ex-USD Bond Index measures the performance of investment grade debt from 24 local-currency markets. This multi-currency benchmark includes sovereign, government-related, corporate and securitized fixed-rate bonds from both developed and emerging markets issuers. Bonds issued in US dollars are excluded.

Bloomberg US Aggregate Bond measures the performance of investment grade, US dollar-denominated, fixed-rate taxable bond market, including Treasuries, government-related and corporate securities, MBS (agency fixed-rate and hybrid ARM passthroughs), ABS and CMBS.

Bloomberg US Corporate Bond Index measures the performance of investment grade, fixed-rate, taxable corporate bond market. It includes US dollar-denominated securities publicly issued by US and non-US industrial, utility and financial issuers.

Bloomberg US Corporate High Yield Bond Index measures the performance of the US dollar-denominated, high yield, fixed-rate corporate bond market. Securities are classified as high yield if the middle rating of Moody’s, Fitch and S&P is Ba1/BB+/BB+ or below. Bonds from issuers with an emerging markets country of risk are excluded.

Bloomberg US Long Treasury Index measures the performance of US dollar-denominated, fixed-rate, nominal debt issued by the US Treasury with a maturity greater than 10 years.

Bloomberg US Mortgage Backed Securities Index measures the performance of fixed-rate agency mortgage-backed pass-through securities guaranteed by Ginnie Mae, Fannie Mae and Freddie Mac.

Bloomberg US Treasury Index measures the performance of US dollar-denominated, fixed-rate, nominal debt issued by the US Treasury. Treasury bills are excluded by the maturity constraint but are part of a separate Short Treasury Index.

Bloomberg US Treasury Inflation-Linked Bond Index measures the performance of the US Treasury inflation-protected securities (TIPS) market. Federal Reserve holdings of US TIPS are not index eligible and are excluded from the face amount outstanding of each bond in the index.

Credit Suisse Emerging Market Corporate Index measures the performance of emerging market corporate debt that represents the characteristics, pricing and total return performance of different asset classes within the emerging market corporate universe.

ICE BofA AAA US Corporate Index measures the performance of US dollar-denominated investment grade rated corporate debt publicly issued in the US domestic market with a given credit rating AAA.

ICE BofA AA US Corporate Index measures the performance of US dollar-denominated investment grade rated corporate debt publicly issued in the US domestic market with a given credit rating AA.

ICE BofA Single-A US Corporate Index measures the performance of US dollar-denominated investment grade rated corporate debt publicly issued in the US domestic market with a given credit rating A.

ICE BofA BBB US Corporate Index measures the performance of US dollar-denominated investment grade rated corporate debt publicly issued in the US domestic market with a given credit rating BBB.

ICE BofA BB US High Yield Index measures the performance of US dollar-denominated below investment grade rated corporate debt publicly issued in the US domestic market with a given credit rating BB.

ICE BofA Single-B US High Yield Index tracks the performance of US dollar-denominated below investment grade rated corporate debt publicly issued in the US domestic market with a given credit rating B.

ICE BofA CCC & Lower US High Yield Index measures the performance of US-dollar denominated below investment grade rated corporate debt publicly issued in the US domestic market with a given credit rating CCC or below.

Real Asset Indexes
Alerian MLP Index is a capped, float-adjusted, market capitalization-weighted index designed to track the performance of energy infrastructure master limited partnerships (MLPs).

FTSE EPRA Nareit Global Real Estate Index is a float-adjusted, market capitalization-weighted index designed to track the performance of listed real estate companies in both developed and emerging countries worldwide.

FTSE Gold Mines Index measures the performance of the shares of companies whose principal activity is the mining of gold and encompasses all gold mining companies that have a sustainable, attributable gold production of at least 300,000 ounces a year and that derive 51% or more of their revenue from mined gold in the worldwide market.

FTSE Gold Mines EMEA Index is a subindex of the FTSE Gold Mines Index Series. It measures the performance of all gold mining companies that have a sustainable, attributable gold production of at least 300,000 ounces a year and that derive 51% or more of their revenue from mined gold across the Europe/Middle East/Africa (EMEA) region.

FTSE Gold Mines Asia Pacific Index is a subindex of the FTSE Gold Mines Index Series. It measures the performance of all gold mining companies that have a sustainable, attributable gold production of at least 300,000 ounces a year and that derive 51% or more of their revenue from mined gold across the Asia Pacific region.

FTSE Gold Mines Americas Index is a subindex of the FTSE Gold Mines Index Series. It measures the performance of all gold mining companies that have a sustainable, attributable gold production of at least 300,000 ounces a year and that derive 51% or more of their revenue from mined gold across the US, Canada and Latin America.

ICE US Dollar Index is a geometrically averaged calculation of six currencies weighted against the US dollar: the euro, Japanese yen, British pound, Canadian dollar, Swedish krona and Swiss franc.

S&P Global ex-US Property Index defines and measures the investable universe of publicly traded property companies domiciled in developed and emerging markets excluding the US. The companies included are engaged in real estate-related activities such as property ownership, management, development, rental and investment.

S&P Global Infrastructure Index measures the performance of 75 companies from around the world chosen to represent the listed infrastructure industry while maintaining liquidity and tradability. To create diversified exposure, the index includes three distinct infrastructure clusters: energy, transportation and utilities.

S&P Global Natural Resources Index measures the performance of 90 of the largest publicly traded companies in natural resources and commodities businesses that meet specific investability requirements, offering investors diversified and investable equity exposure across three primary commodity-related sectors: agribusiness, energy, and metals and mining.

S&P GSCI® is a composite index of commodity sector returns representing an unleveraged, long-only investment in commodity futures that is broadly diversified across the spectrum of commodities.

Alternative Credit Indexes
Cliffwater Direct Lending Index is an asset-weighted index of more than 8,000 directly originated middle-market loans.

JPMorgan CLO Index is a total return benchmark for US dollar-denominated broadly syndicated, arbitrage US CLO debt.

JPMorgan CLO AAA Index is a subset of the JPMorgan CLO Index that only tracks the AAA rated CLO debt.

JPMorgan CLO AA Index is a subset of the JPMorgan CLO Index that only tracks the AA rated CLO debt.

JPMorgan CLO A Index is a subset of the JPMorgan CLO Index that only tracks the A rated CLO debt.

JPMorgan CLO BBB Index is a subset of the JPMorgan CLO Index that only tracks the BBB rated CLO debt.

JPMorgan CLO BB Index is a subset of the JPMorgan CLO Index that only tracks the BB rated CLO debt.

JPMorgan CLO B Index is a subset of the JPMorgan CLO Index that only tracks the B rated CLO debt.

Morningstar LSTA US Leveraged Loan Index is a market value-weighted index designed to measure the performance of the US leveraged loan market.

Morningstar LSTA US BBB Ratings Loan Index is a market value-weighted index designed to measure the performance of the US leveraged loan market for loans with BBB- to BBB+ ratings as rated by S&P Global Ratings.

Morningstar LSTA US BB Ratings Loan Index is a market value-weighted index designed to measure the performance of the US leveraged loan market for loans with BB- to BB+ ratings as rated by S&P Global Ratings.

Morningstar LSTA US B Ratings Loan Index is a market value-weighted index designed to measure the performance of the US leveraged loan market for loans with B- to B+ ratings as rated by S&P Global Ratings.

Morningstar LSTA US CCC Ratings Loan Index is a market value-weighted index designed to measure the performance of the US leveraged loan market for loans with CCC- to CCC+ ratings as rated by S&P Global Ratings.

FEF Distributors, LLC (Member SIPC) distributes certain First Eagle products; it does not provide services to investors. As such, when FEF Distributors, LLC presents a strategy or product to an investor, FEF Distributors, LLC does not determine whether the investment is in the best interests of, or is suitable for, the investor. Investors should exercise their own judgment and/or consult with a financial professional prior to investing in any First Eagle strategy or product. First Eagle Investments is the brand name for First Eagle Investment Management, LLC and its subsidiary investment advisers. © 2023 First Eagle Investment Management, LLC. All rights reserved.