


Macro & Market Views
Confidence Game
Confidence Game
Reflections 2025-2026
Financial market valuations, particularly in the US, continued to richen in 2025 despite a deck full of wildcards. As Head of Global Value Matt McLennan—together with Deputy Heads Julien Albertini and Christian Heck and Senior Research Advisor Kimball Brooker—discuss, however, there’s a fine line between confidence and hubris, and they believe the low risk perception evident in certain markets leaves them particularly vulnerable to the latter. In an environment of fat-tail risks and full valuations, the Global Value team is focused on assets whose scarcity value positions them to participate in the nominal drift of the economy and preserve real purchasing power.
Low Risk Perception Persists amid “Equipoise” in Economy
Given rich equity market valuations (particularly among growth names), tight credit spreads and low implied volatility, the current environment in the US is one of high confidence, in our estimation. While downside risks are plentiful, as we will discuss, this ebullience is not without a foundation in reality. Corporate earnings growth forecasts remain constructive, driven by factors ranging from the impact of the artificial intelligence (AI) "CapEx" cycle to accommodative fiscal conditions. At the same time, short-term interest rates have drifted lower from the start of the year as expectations of easier Federal Reserve policy mounted and ultimately were realized; after being on pause for much of 2025, the central bank cut the federal funds rate by 25 basis points in September, October and December.1
Markets may be further encouraged by conditions John Williams, president of the New York Fed, has described as “equipoise.”2 A cooling labor market and moderating inflation have brought the risks to each into balance, according to Williams, suggesting that significant progress has been made toward a post-pandemic soft landing for the economy. This normalization is encouraging.
Still abnormal and discouraging, however, are the country’s fiscal settings. As shown in Exhibit 1, the federal deficit remains historically outsized relative to the unemployment rate—as it has since the outbreak of Covid-19. Normally, high unemployment rates and recession beget large fiscal deficits, as lower tax revenues combine with increased government spending. Conversely, low unemployment rates and robust economic growth typically support higher tax revenues and tighter fiscal policy, causing deficits to contract or even turn into surpluses. If the economy were truly in equipoise, we’d expect budget deficits of around 2% of GDP—not the 6%-plus we’re at today.
Exhibit 1. Recent Deficits Have Been Historically Wide Relative to Unemployment
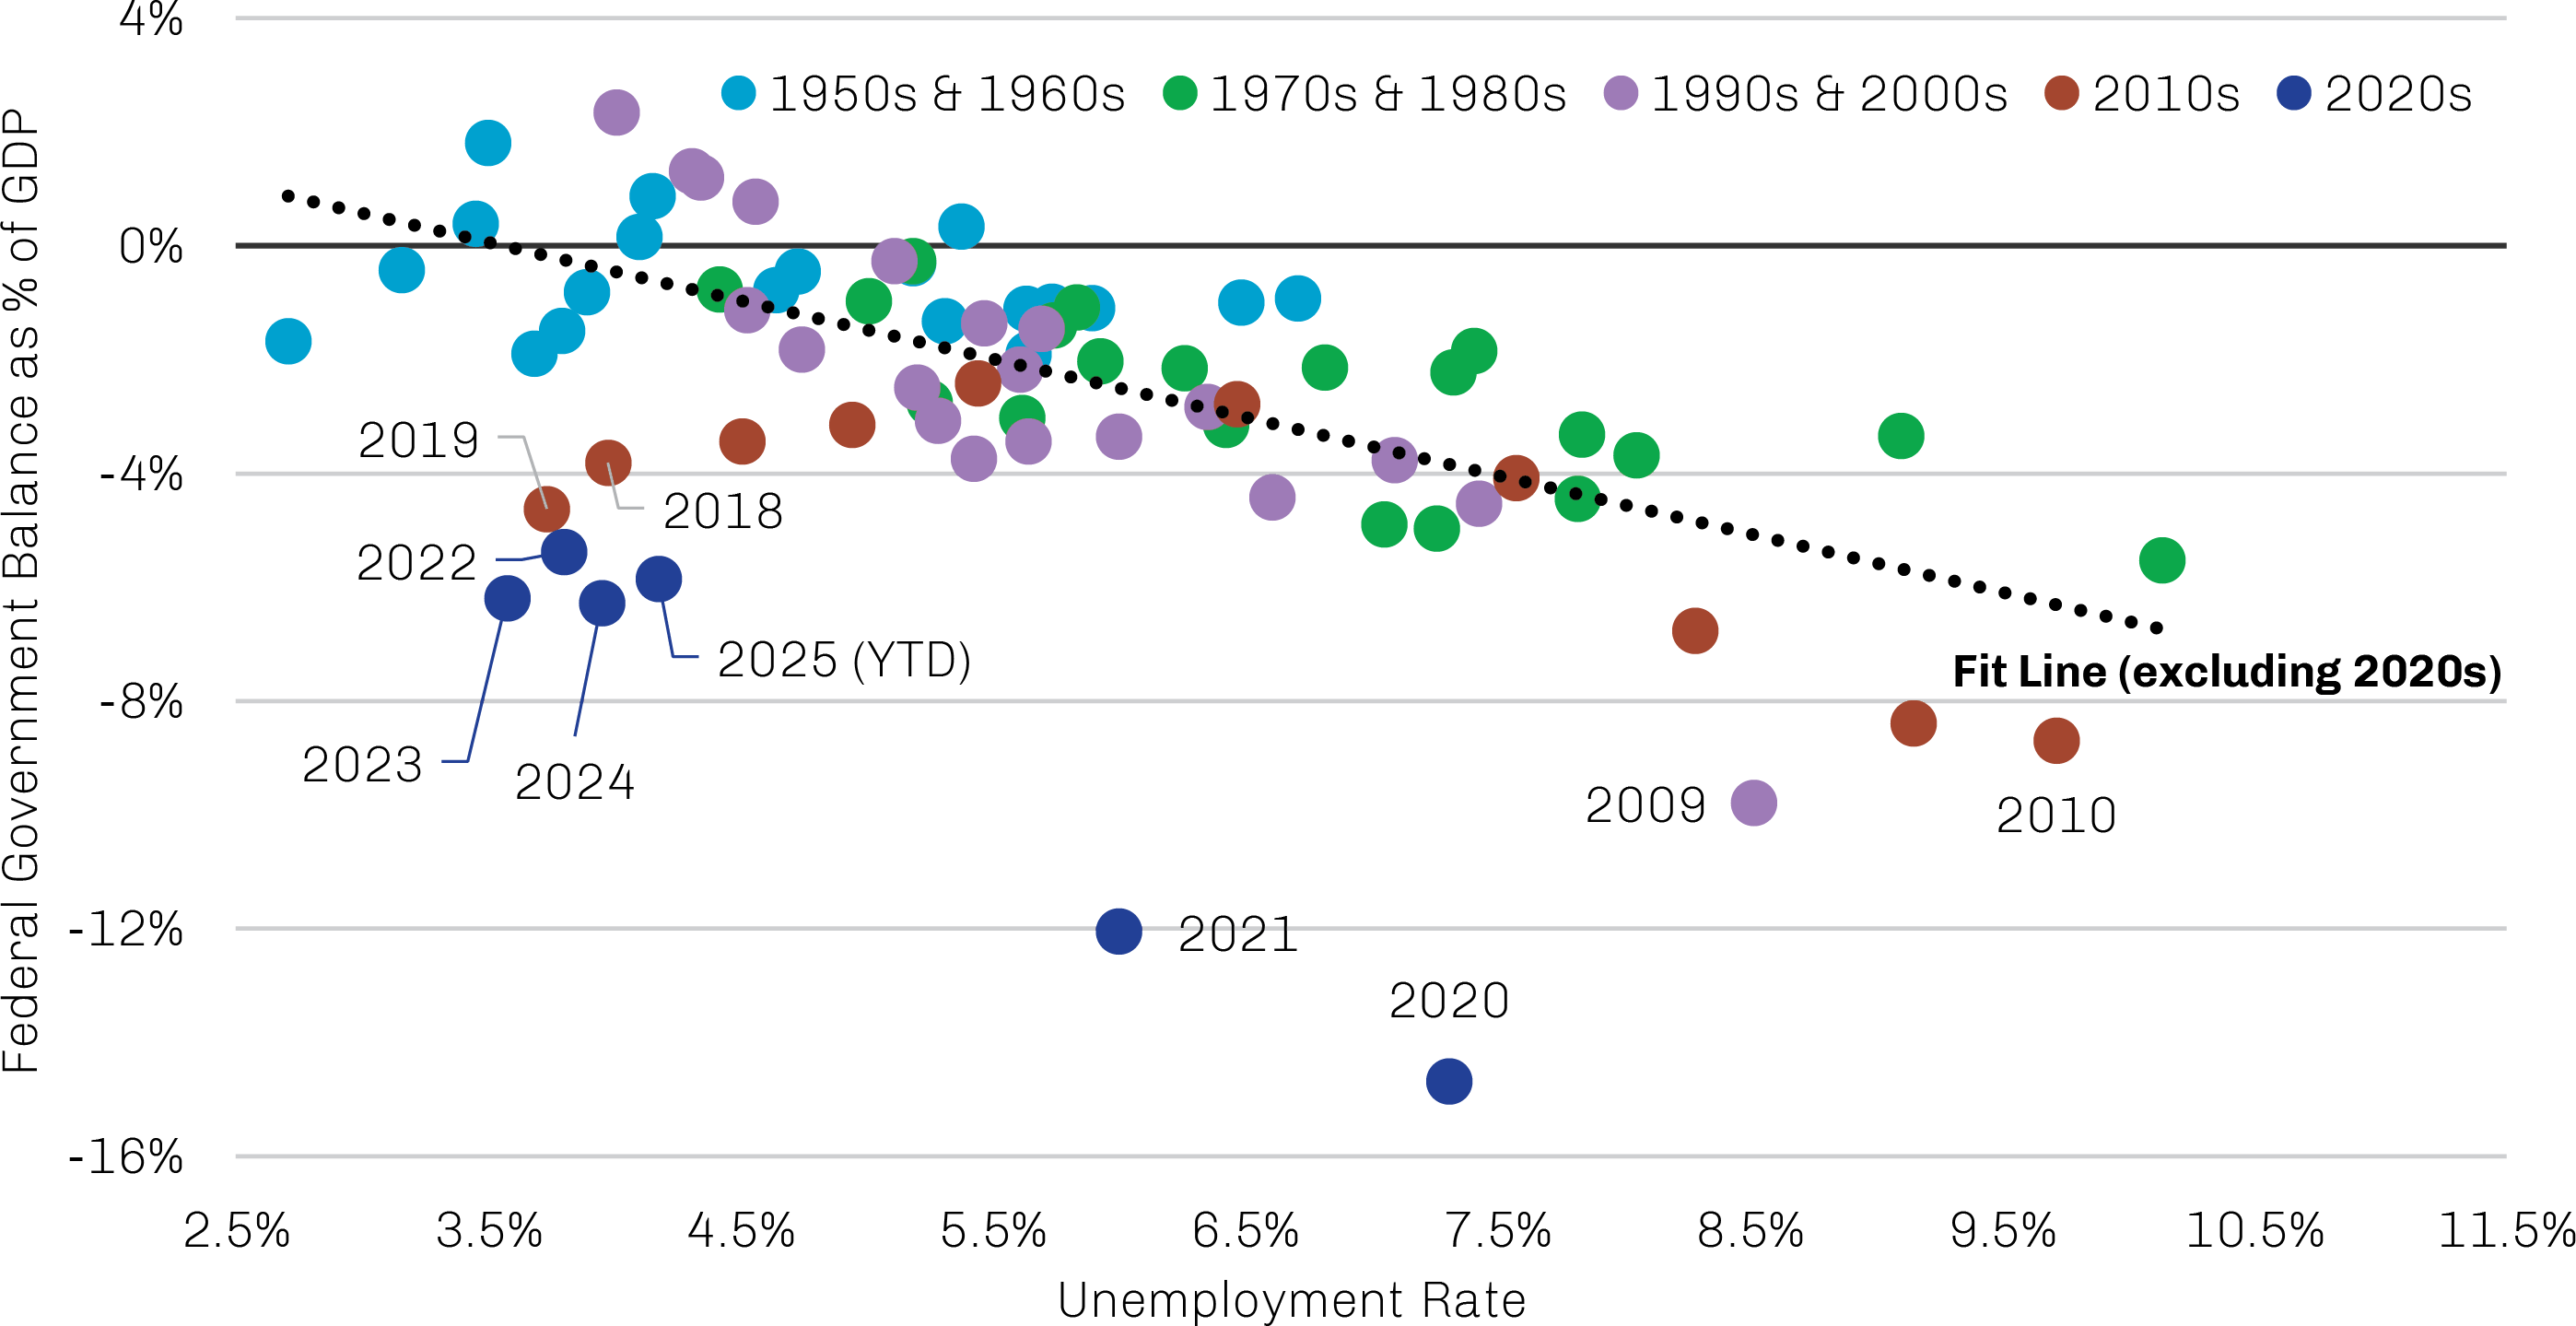
Source: Haver Analytics, Bureau of Economic Analysis, US Treasury, Federal Reserve Bank of St. Louis; data as of November 30, 2025.
We believe this persistent deficit spending helps explain the decoupling of gold and Treasuries seen in recent years, as shown in Exhibit 2. Gold prices appear to be acknowledging the double-bind facing US policymakers: Do nothing to address the deficit and increase the risk of inflation, or take action to curb deficit spending and increase the risk of recession. More recent rallies in the prices of other precious metals like silver and platinum appear to reflect the same policy conundrum.3
Exhibit 2. The Performance of Gold and Treasuries Has Decoupled
Index: January 2015 = 100
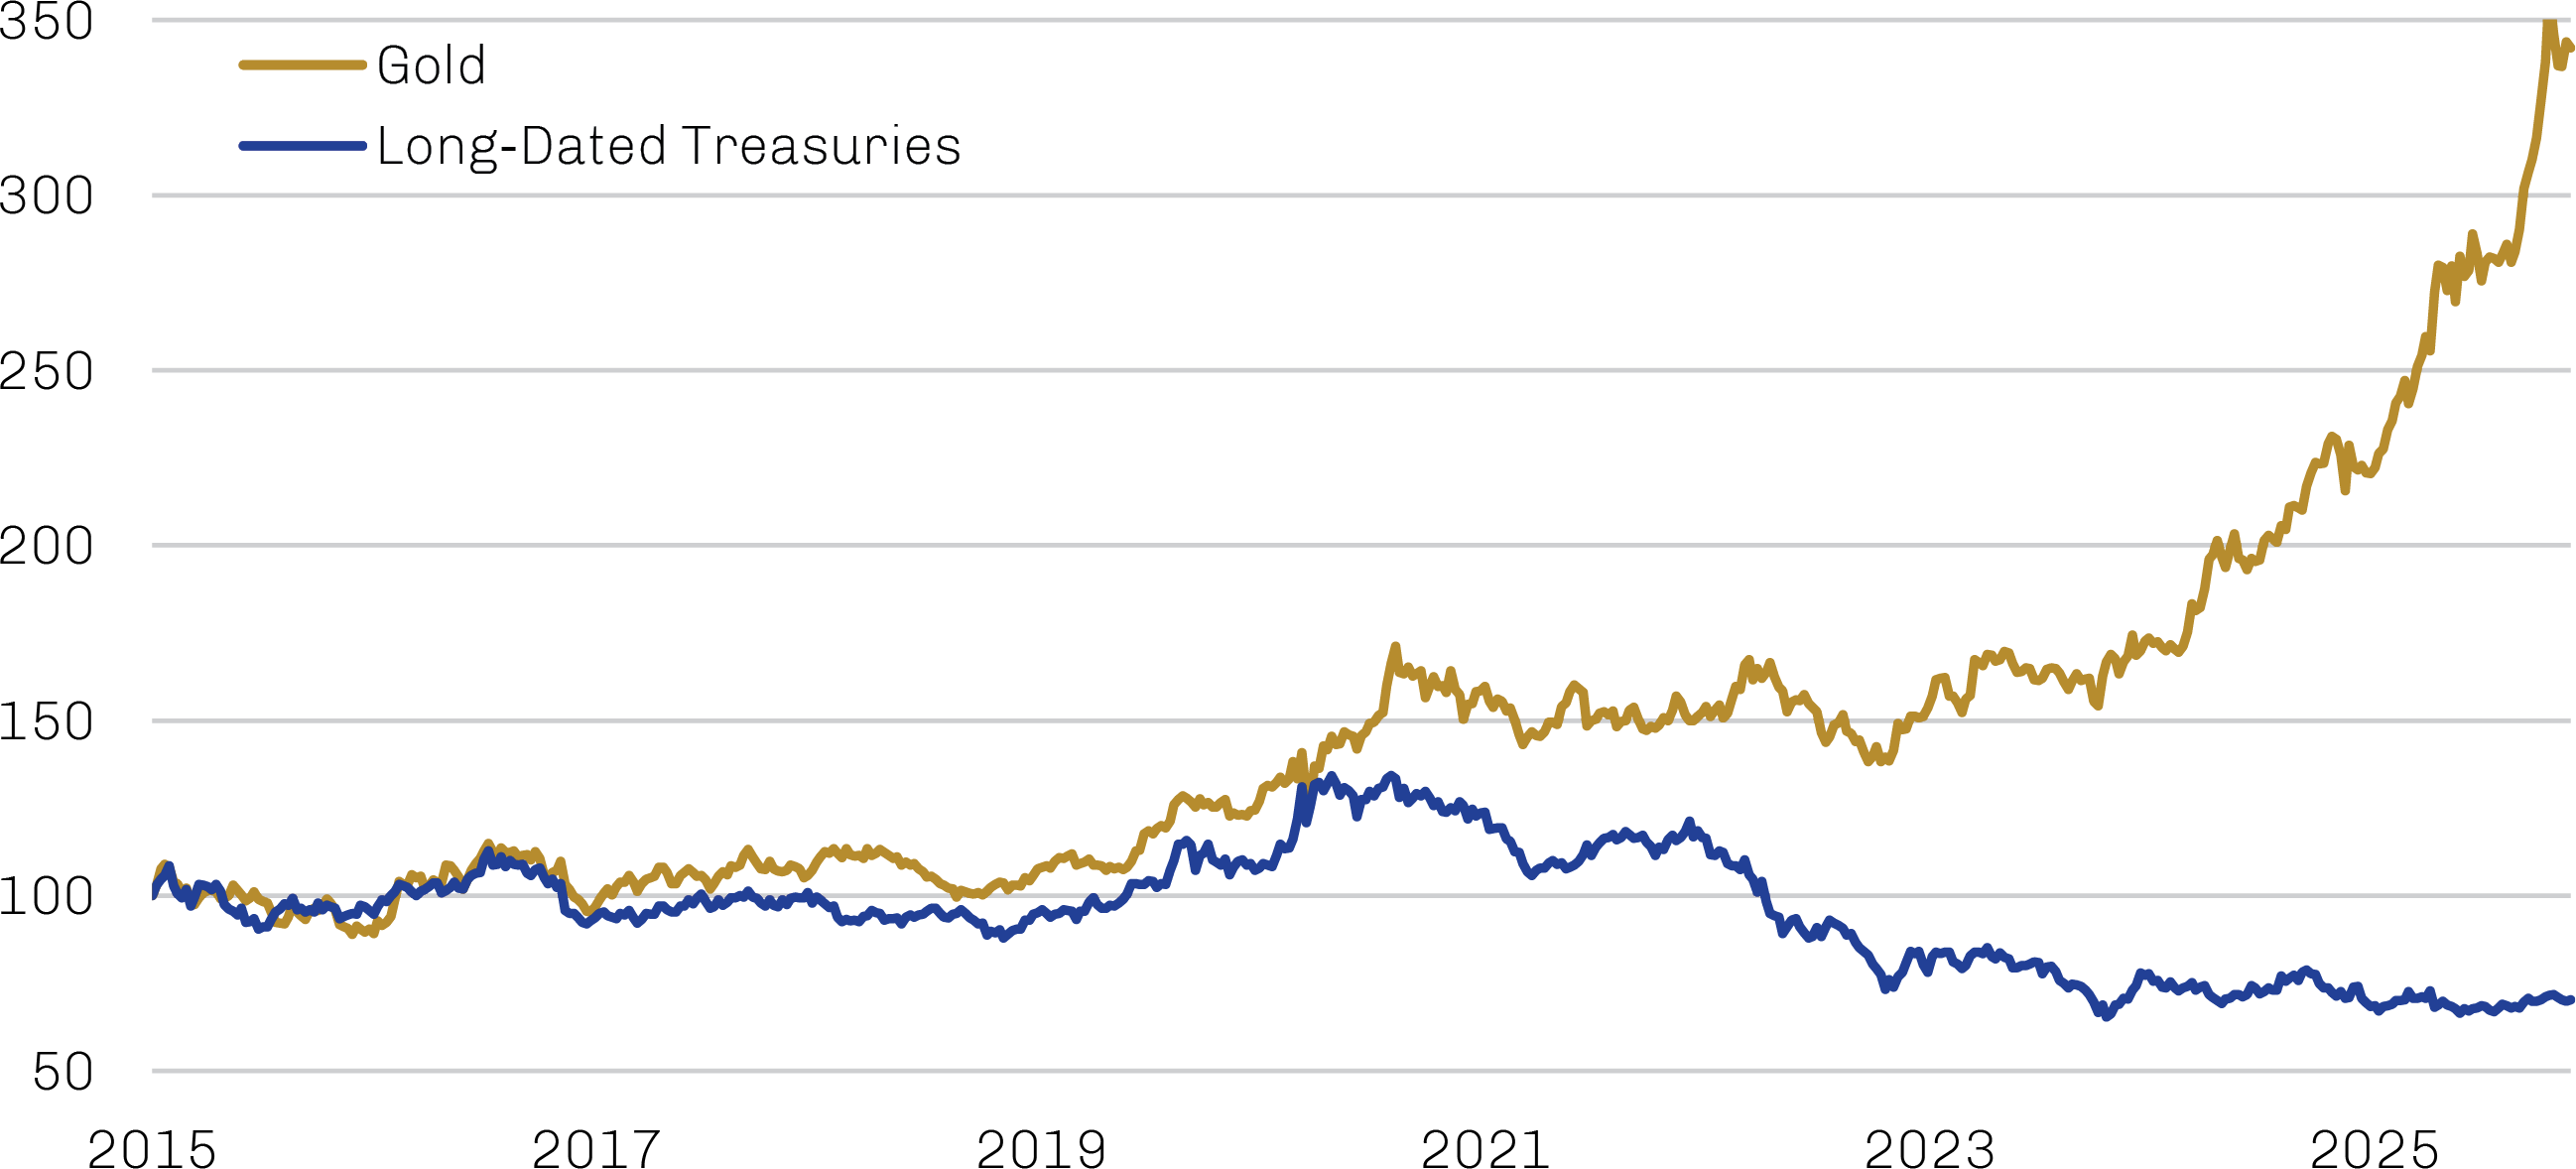
Note: Long-dated Treasuries are represented by iShares 20+ Year Treasury Bond ETF.
Source: Bloomberg; data as of November 30, 2025.
Persistent deficit spending has also imparted some positive nominal drift to the economy, which has trickled down into corporate earnings and margins and by extension forestalled potential recession amid the 2022–23 Fed tightening cycle. Consensus earnings expectations—which likely reflect current fiscal settings—forecast growth to continue through at least calendar 2026, potentially offering support for equity markets. Continued earnings growth may also support increased demand for labor at the same time a burgeoning supply shock unfolds, driven by demographic trends and immigration policy, which could reintroduce wage inflation that threatens the equipoise narrative.
The natural increase in the US population—that is, the difference between births and deaths—has been in decline for much of the twenty-first century as Baby Boomers age and Americans have fewer children.4 Though this has been more than offset by net immigration, this source of labor figures to shrink dramatically should the Trump administration maintain its aggressive immigration policy.5 Indeed, the Congressional Budget Office expects net immigration to grow 0.1% this year, down from 0.8% in 2024.6
Meanwhile, the One Big Beautiful Bill, enacted in July, extended or made permanent many of the tax provisions slated to expire at year-end 2025, leaving fiscal settings at excessively accommodative levels. With tax receipts biased lower and bipartisan consensus on entitlement reform remaining elusive, Trump has looked to tariffs—which are effectively a backdoor consumption tax—as an alternative source of federal revenue. Even at levels rivaling those seen in the 1930s, however, the current effective tariff rate will likely have little impact on fiscal dynamics. As shown in Exhibit 3, tariff revenue in 2025 is estimated to reduce the deficit slightly before widening resumes in 2026 and beyond driven by increased spending on healthcare, Social Security and defense, and higher interest expenses. Were the Supreme Court to strike down Trump’s ability to impose tariffs under the International Emergency Economic Powers Act, as it is currently considering, revenue generated by the levies will likely fall; however, it’s quite possible the Trump administration would seek other legal justifications to reimpose any cancelled tariffs.
Tariffs are effectively a backdoor consumption tax and an alternative source of federal revenue.
Exhibit 3. At Current Levels, Tariffs Will Have Little Impact on the Deficit
Federal Fiscal Balance as a % of GDP
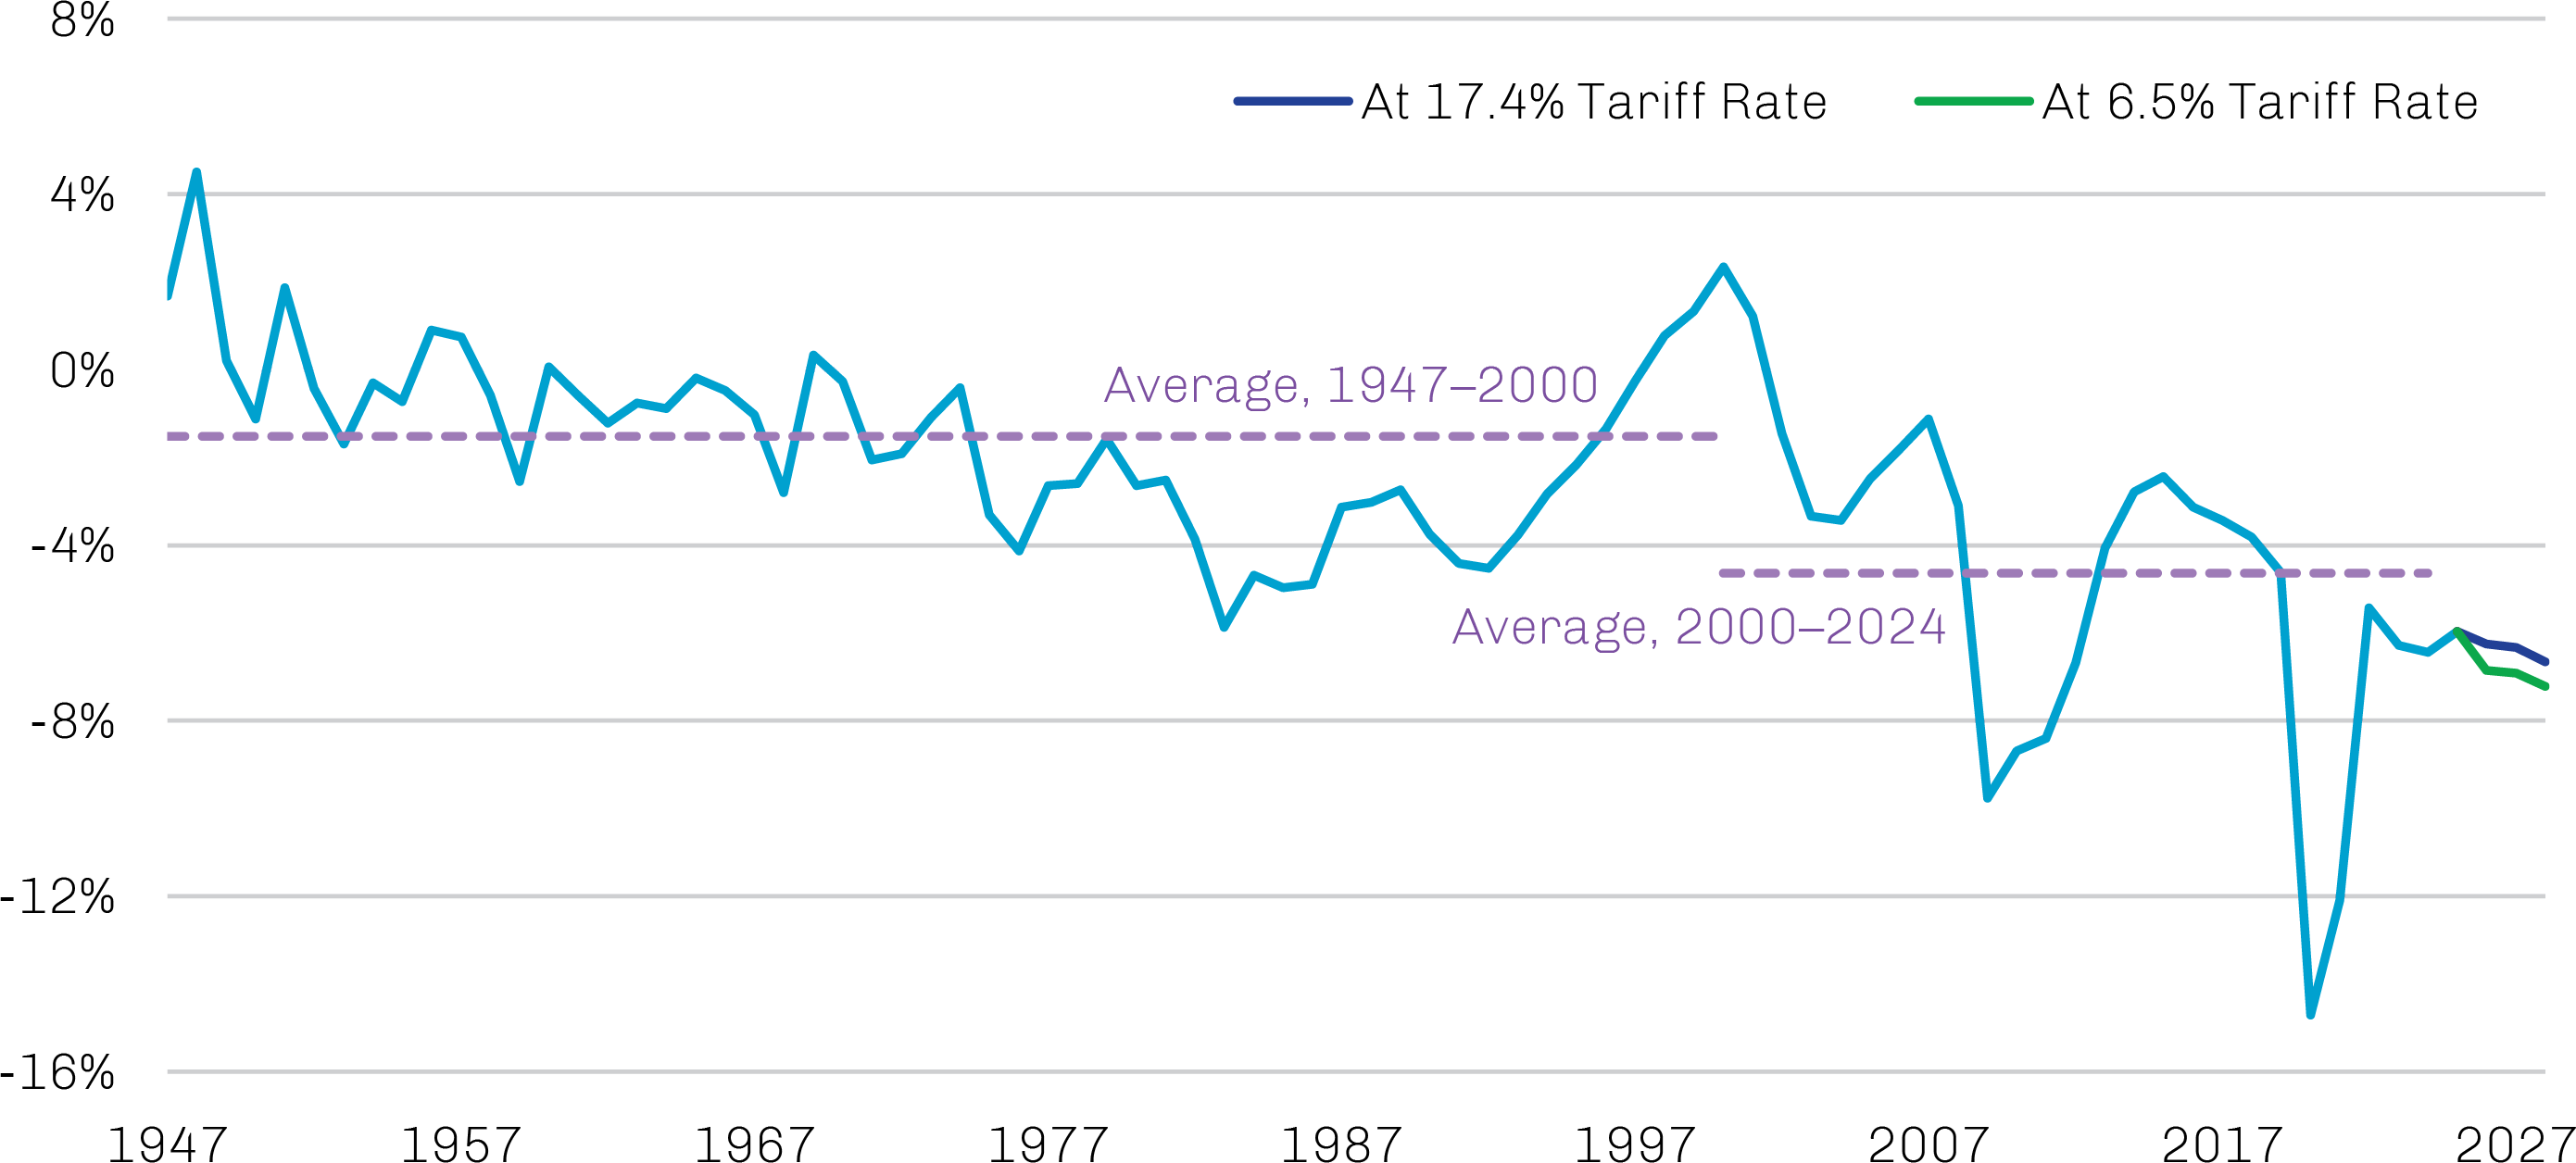
Source: Haver Analytics, Congressional Budget Office, Office of Management and Budget, Piper Sandler, Yale Budget Lab; data as of September 30, 2025. First Eagle Investments forecasts for 2025 and beyond.
Everyone Choose Sides
As the US sinks deeper into its fiscal quagmire, we’ve seen the geopolitical bifurcation of the world continue apace. We’re reminded of a quote from geostrategist Halford Mackinder in 1904: “Whoever controls the Eurasian Heartland controls the world.” While the US’s role on the global stage has become harder to define, bonds connecting the authoritarian powers concentrated in eastern Europe and Asia—China, Russia, Iran and North Korea—have strengthened; a September military parade in Beijing attended by the leaders of Russia and North Korea is just one example of the burgeoning affection among this cohort.
Beyond ideology, this shift is being expressed in monetary behaviors. Since the West froze Russia’s official foreign reserves following its 2022 invasion of Ukraine, a range of countries—driven by concerns about the potential weaponization of their reserve assets—have diversified their holdings, primarily by increasing their allocations to gold. Gold purchases by global central banks have exceeded 1,000 tonnes in each of the past three full years after reaching only 450 tonnes in 2021, and purchases are on track for the high triple digits in 2025.7 As a result, gold holdings as a share of foreign reserves now exceed Treasuries for the first time in 30 years.8 Steady central bank buying also has helped support the price of gold, which— unusually—has rallied alongside equities, more than doubling in price since the beginning of 2024.9
Gold holdings as a share of foreign reserves now exceed Treasuries for the first time in 30 years.
Non-US Equity Valuations Appear Modest Compared to the US
Financial markets, for their part, seem unfazed by these fat-tailed fiscal and geopolitical risks. This is especially true in the US, where any number of indicators suggest low risk perception, including volatility metrics, the ratio of the S&P 500 to consumer price index-adjusted trailing peak earnings, and the relative valuations of US growth and value stocks.
Despite the strong performance of non-US equities thus far in 2025—the MSCI World ex USA Index has gained 25.8% through November-end compared to 17.8% for the S&P 500—the price ratio of US stocks to non-US names is well more than double the long-term average, as shown in Exhibit 4, suggesting that some degree of latency remains in non-US markets. The US equity market is trading at around 25x earnings, which is equivalent to a 4% earnings yield, while non-US markets are at 16x earnings, or about a 6% yield.10 Unless US productivity growth can account for that 2% spread, global diversification appears compensatory on valuation alone.
Financial markets, especially in the US, seem unfazed by these fat-tailed fiscal and geopolitical risks.
Exhibit 4. US Equity Valuations Remain Stretched Compared to World
Price Ratio of S&P 500 Index to MSCI World ex-USA Index
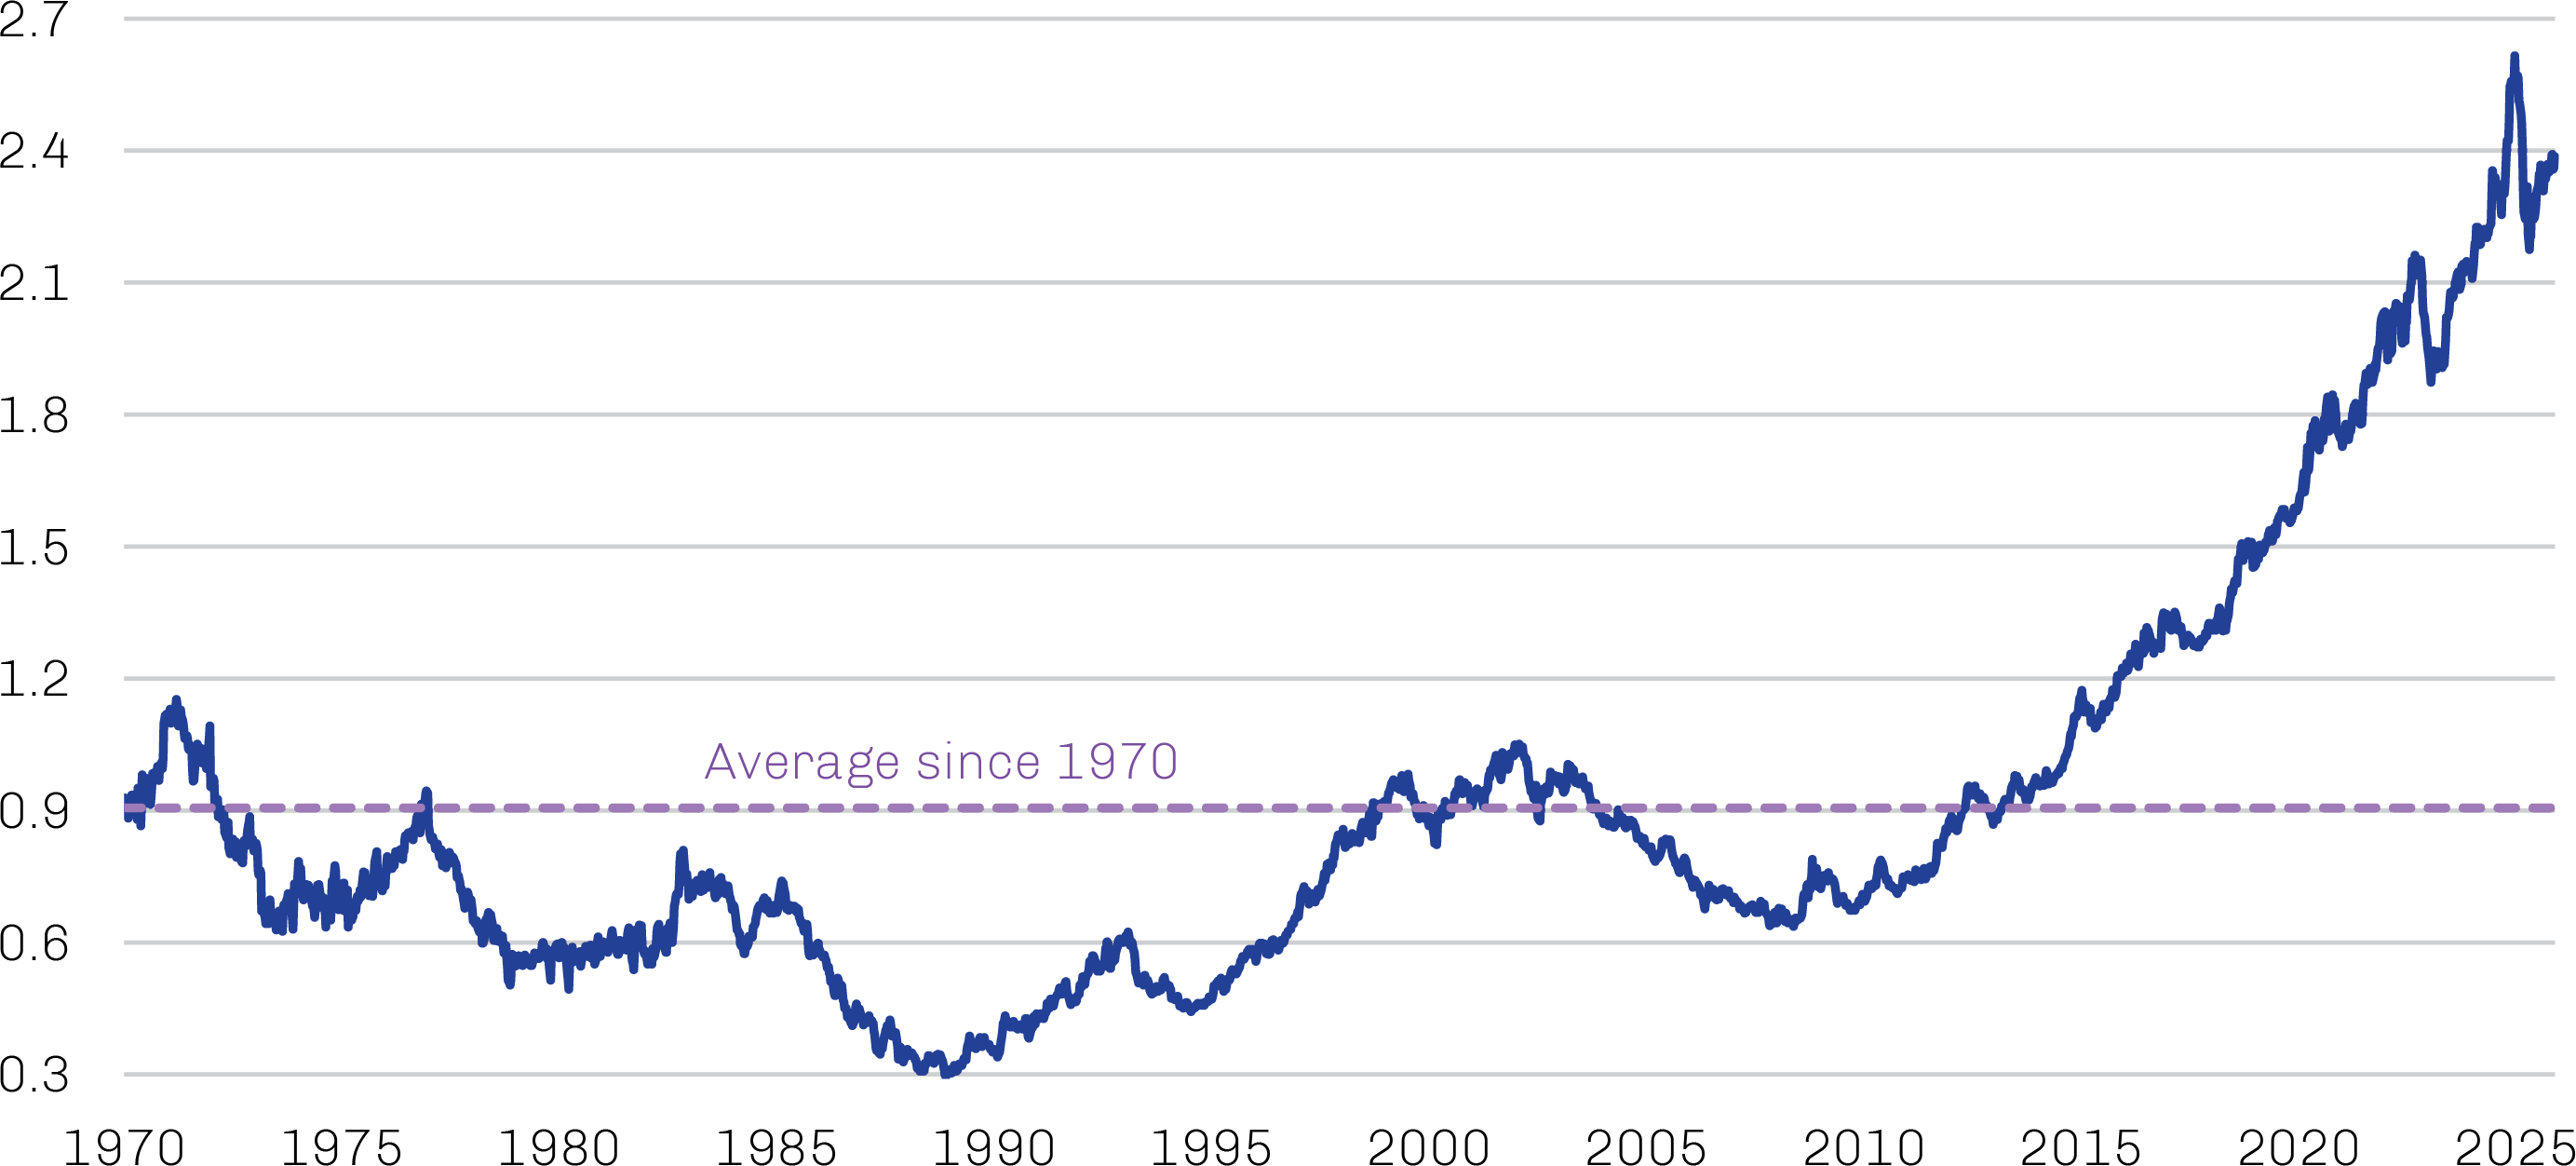
Source: Bloomberg; data as of November 30, 2025.
Meanwhile, there are signs animal spirits are reawakening in a range of non-US markets, both developed and emerging, adding meat to the relative valuation bone. In Europe, for example, Germany has taken steps to leverage its ample fiscal capacity, notably on defense and infrastructure projects,11 and NATO countries as a whole agreed to raise annual defense spending to 5% of GDP by 2035.12 China’s ongoing debt-restructuring initiative for local governments—earmarked at 12 trillion yuan—appears to be bearing fruit, reducing local government’s debt service payments and their shakedown of local businesses.13 In Japan, the country’s new— and first female—prime minister has a reputation as a pro-spending conservative who also favors stimulative monetary policy.14
Dollar weakness has been another tailwind for non-US equity markets during 2025, as the ICE US Dollar Index has shed more than 8% year to date.15 Historically, US equities have tended to outperform non-US names during periods of dollar strength, while the opposite has been true when the dollar was weak. While we won’t hazard a guess on the dollar’s behavior going forward, we would note that currency regime shifts historically have been durable. Given that the period of dollar strength from which we just emerged began in 2011, we’re open to the possibility that 2025 represented only the beginning of a weak-dollar phase.
Investing with Purpose
We in the Global Value team are great believers that investing done well is investing done with purpose. Our particular sense of purpose has long been focused on resilient wealth creation—the notion that capital can be deployed in such a way that it keeps pace with the nominal drift of the economy over time and thus retains its purchasing power. Further, we believe an emphasis on downside mitigation can encourage clients to remain invested during challenging markets and support the long-term compounding of their assets.
Our focus on resilient wealth creation aims to keep pace with nominal drift and retain purchasing power.
Perhaps counterintuitively to some, we believe the most effective way to fulfill our purpose—far better than “safe” short-term government securities—is through thoughtful allocations to risk assets.
Our perspective hinges on differentiating between what we describe as “fixed principal” assets and “fixed positional” assets. Treasury bills, for example, are fixed principal assets; the yield paid to investors is fixed, as is the nominal value of the bill at maturity. Considered risk-free due to its explicit US government backing, every T-bill held to maturity has paid its investors exactly what was promised, no more and no less. While such stability has its merits, it also has its drawbacks; as the supply of these assets varies over time with the funding needs of the government, their real, inflation-adjusted value at maturity is unknowable.
In contrast, gold and equities are examples of fixed positional assets; while their yield is variable or nonexistent and their terminal value is unknown, their relatively fixed supply historically has enabled them to participate in the nominal drift of the economy. As nominal prices have increased alongside the expanding money supply and growing government debt, gold and equity prices have kept pace.
Exhibit 5 serves as a good example of how this dynamic has played out over time. The cumulative return of short-term Treasuries has climbed steadily throughout the measurement period with little price volatility, which should not come as a surprise for an asset with a fixed coupon, fixed principal and theoretically zero risk of default. But this return significantly lags the supply growth of Treasuries, as represented by the stock of public debt. Which is to say that the real value of these Treasury returns has eroded over the long term as more and more debt was issued. In contrast, a fixed-positional asset like gold, while volatile in nominal terms, has kept pace with the growth of government debt outstanding, delivering a far stronger real return compared with Treasuries.
The relatively fixed supply of assets like gold and equities historically has enabled them to participate in the nominal drift of the economy.
Exhibit 5. Gold Has Kept Pace with Nominal Drift over Time
Index: 1968 = 100
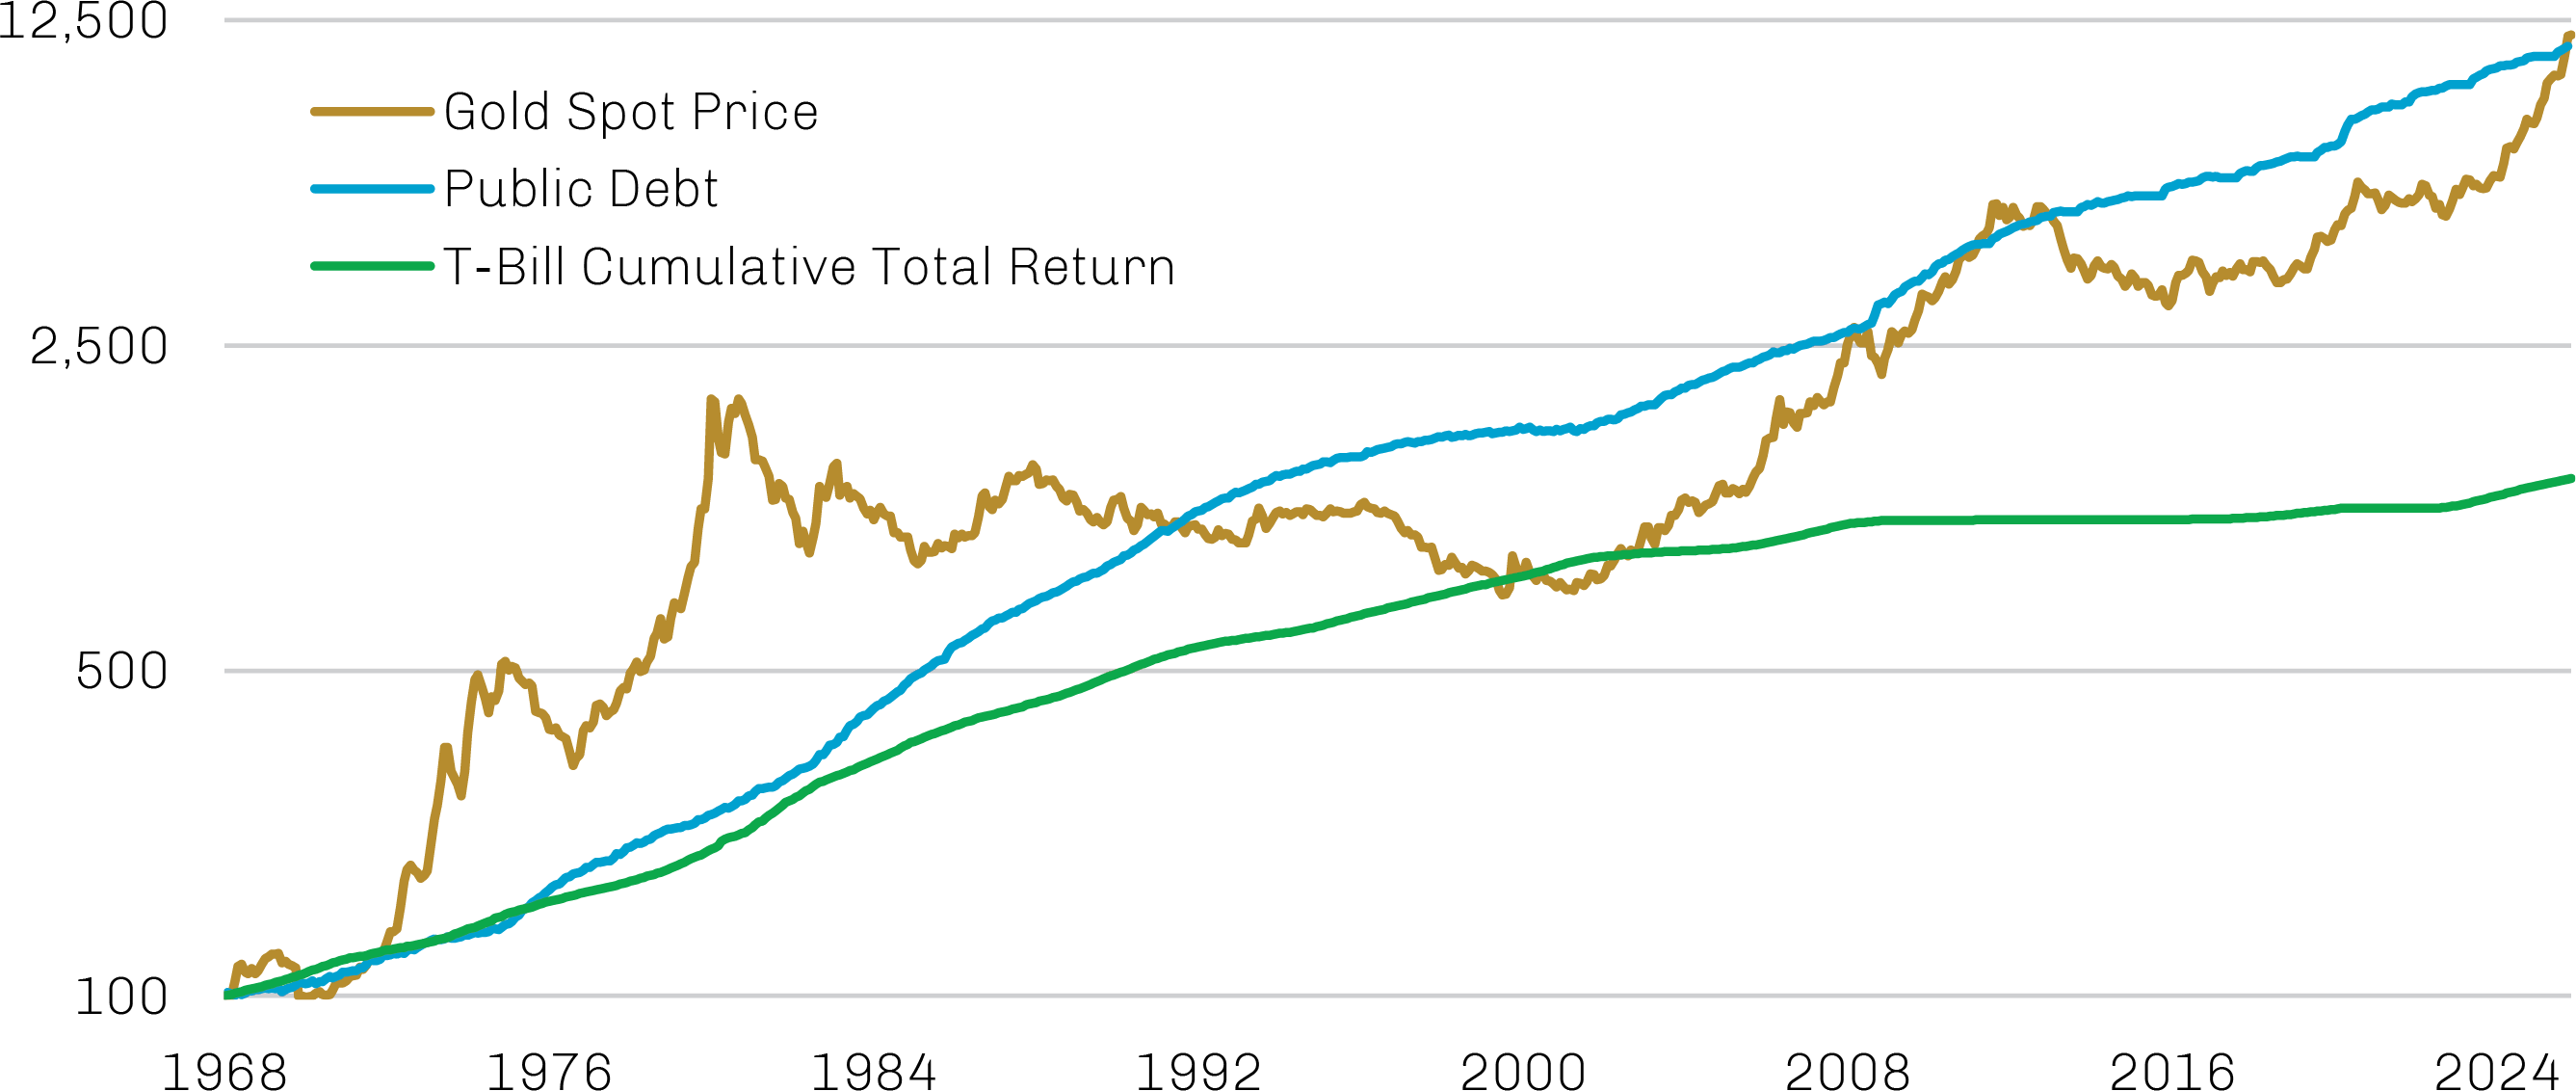
Note: The Treasury bill return is based on constant maturity yields from the US Treasury, assuming that the holding is rolled every trading day into a new instrument of like maturity.
Source: Haver Analytics, Bloomberg, Federal Reserve; data as of November 30, 2025.
A similar trajectory could be seen in the price of equities, even as the relative value of gold and equities has fluctuated over time. Gold generally has been worth more than equities during periods of low confidence in markets and the economy, such as the Great Depression, stagflation in the 1970s and the global financial crisis. Equities have led during periods of confidence, such as the Roaring Twenties, the post-war boom years of the 1950s and ‘60s, and the 1990s internet boom. As the confidence pendulum has swung back and forth over time, a portfolio that included exposure to both gold and equities would have been more stable than owning either in isolation, as shown in Exhibit 6.
Exhibit 6. Gold and Equities Together Have Provided a Smoother Ride than Either Alone
Gold Spot Price and S&P 500 Index, Logarithmic Scale
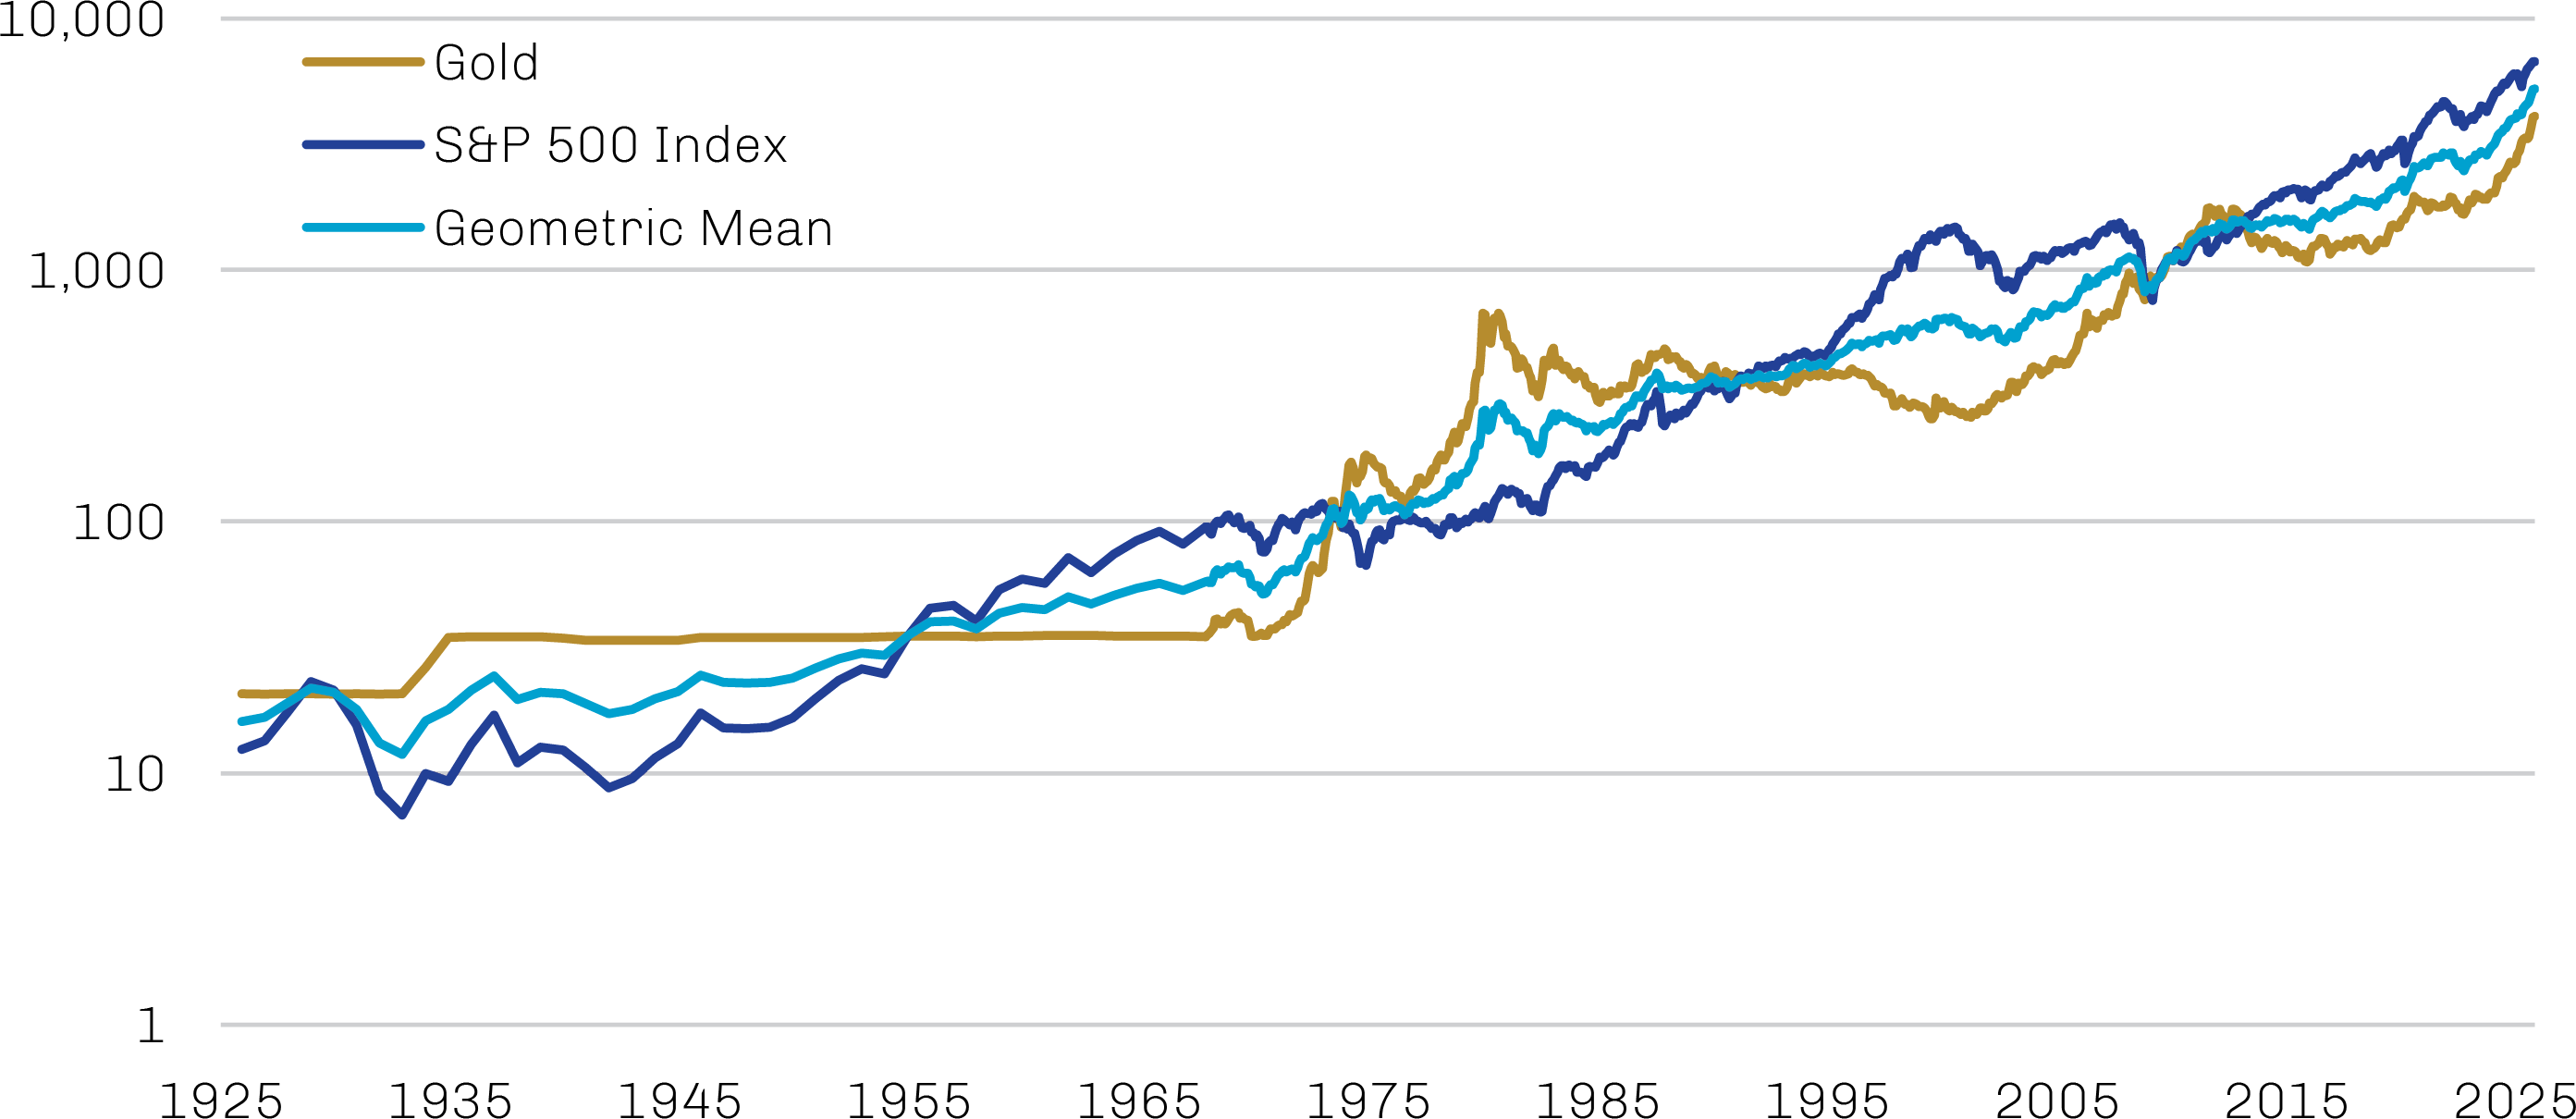
Note: Data are annual prior to 1968 and are monthly thereafter.
Source: Bloomberg, Federal Reserve, Haver Analytics; data as of November 30, 2025.