


Commentaries
Gold Fund Commentary
Gold Fund Commentary
Portfolio Review
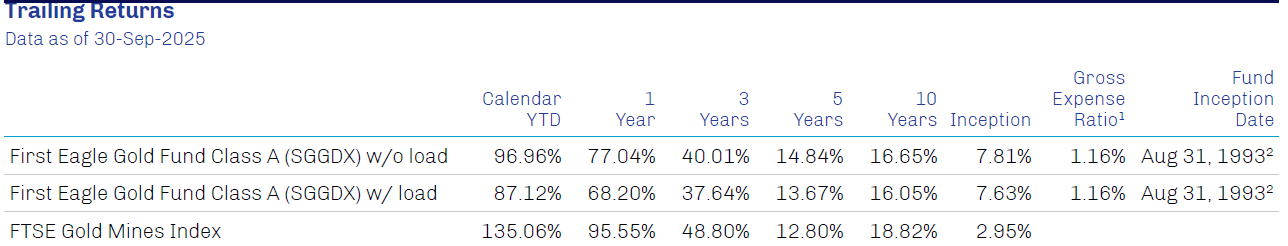
Gold Fund A Shares (without sales charge*) posted a return of 34.28% in third quarter 2025. Gold bullion and gold-related equities both contributed to performance. The Gold Fund underperformed the FTSE Gold Mines Index in the period.
Leading contributors in the First Eagle Gold Fund this quarter included gold bullion, Newmont Corporation, Agnico Eagle Mines Limited, Wheaton Precious Metals Corp and Kinross Gold Corporation.
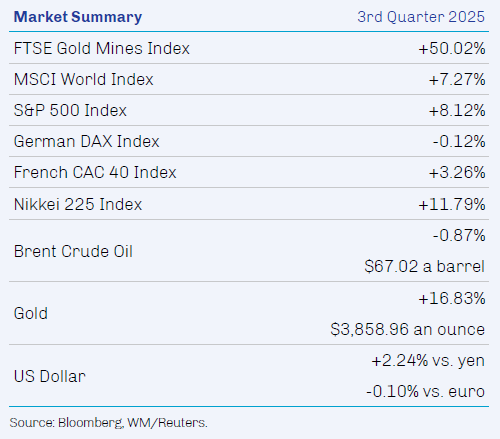
The factors driving the performance of gold bullion during the quarter were discussed in detail in the Market Overview section of this report.
Newmont is one of the world’s largest gold miners and a major producer of silver. Newmont continued to deliver into both cost and production guidance during the quarter—undiminished by usual seasonality—resulting in record free cash flow generation. As part of its portfolio rationalization plan, Newmont monetized stakes in Greatland Resources and Discovery Silver in June and July, respectively, and sold its stake in Orla Mining in September; proceeds were applied to reducing debt and buying back shares. Meanwhile, investors appeared to take changes to Newmont’s executive suite—including both the unanticipated resignation of its CFO in July and the announcement of long-anticipated succession plans for its CEO—in stride.
Agnico Eagle is a senior Canadian gold producer and one of the largest gold miners in the world. The company reported that production exceeded expectations during the quarter, while strong operations drove record revenues and cash flow. Like Newmont, Agnico sold its position in Orla Mining, which bolstered its already strong balance sheet and underpinned sustained dividend payments and stock buybacks.
Reflecting strong dynamics for gold pricing, all holdings in the portfolio delivered positive returns during the quarter, with the smallest contributions from Pan American Silver Corp. Contingent Value Rights, Orla Mining Ltd., Pan American Silver Corp., Royal Gold Inc and B2Gold Corp.
Pan American Silver is a Canadian mining company with large silver endowments and a diversified portfolio of producing mines. We hold small positions in both its contingent value rights (CVRs) and equity. Price changes in the company’s CVRs reflect expectations of the prospective reopening of the company’s shuttered Escobal silver mine in Guatemala rather than moves in underlying metals prices or its strong business model. Despite prospectively meaningful dialogue between the Indigenous Parliament and Guatemala’s Ministry of Energy and Mines during the quarter, the Escobal mine remains on care and maintenance—pending compliance with Indigenous consultation guidelines—with no target date to resume operations.
Orla Mining is a Canadian junior producer that owns two producing mines (the recently acquired Musselwhite in Canada, and Camino Rojo in Mexico), one feasibility-stage mine (South Railroad in Nevada) and one pre-feasibility project (Cerro Quema in Panama). Before delivering positive returns for the quarter, shares wavered on reduced short-term production guidance and anticipated remediation costs triggered by a one-time pit wall movement at the Camino Rojo mine. Sales of Orla equity by Newmont and Agnico Eagle also weighed on the stock price. Results reported during the quarter were strong, however, bolstered by production from the Musselwhite mine, from which we anticipate substantial, sustained production and cashflows.
Equity in Pan American Silver entered our portfolio through MAG Silver’s partial-stock acquisition of the company in early September. Owning our position for less than one month masked the shares’ strong performance for the full quarter. Pan American provides broad optionality on silver through its mines across the Americas.
We appreciate your confidence and thank you for your support.
Sincerely,
First Eagle Investments
* Performance for Class A shares without the effect of sales charges and assumes all distributions have been reinvested, and if a sales charge was included values would be lower.
1. Source: Bloomberg, FTSE Russell; data as of September 30, 2025.
2. Source: Reuters, data as of August 8, 2025.
3. Source: Bloomberg; data as of October 1, 2025.
4. Source: World Gold Council; data as of October 3, 2025.
5. Source: World Gold Council; data as of October 7, 2025.
The performance data quoted herein represents past performance and does not guarantee future results. Market volatility can dramatically impact the fund’s short term performance. Current performance may be lower or higher than figures shown. The investment return and principal value will fluctuate so that an investor’s shares, when redeemed may be worth more or less than their original cost. Past performance data through the most recent month end is available at www.firsteagle.com or by calling 800-334-2143. The average annual returns are historical and reflect changes in share price, reinvested dividends and are net of expenses. “With sales charge” performance for Class A Shares gives effect to the deduction of the maximum sales charge of 3.75% for periods prior to March 1, 2000, and of 5.00% thereafter. The average annual returns for Class C Shares reflect a CDSC (contingent deferred sales charge) of 1.00% in the year-to-date and first year only. Class I Shares require $1MM minimum investment and are offered without sales charge. Class R6 Shares are offered without sales charge. Operating expenses reflect the Fund’s total annual operating expenses for the share class as of the Fund’s most current prospectus, including management fees and other expenses.
1. The annual expense ratio is based on expenses incurred by the fund, as stated in the most recent prospectus.
Investments are not FDIC insured or bank guaranteed and may lose value.
Risk Disclosures
All investments involve the risk of loss of principal.
Diversification does not guarantee investment returns and does not eliminate the risk of loss.
Investment in gold and gold-related investments present certain risks, including political and economic risks affecting the price of gold and other precious metals like changes in US or foreign tax, currency or mining laws, increased environmental costs, international monetary and political policies, economic conditions within an individual country, trade imbalances and trade or currency restrictions between countries. The price of gold, in turn, is likely to affect the market prices of securities of companies mining or processing gold and, accordingly, the value of investments in such securities may also be affected. Gold related investments as a group have not performed as well as the stock market in general during periods when the US dollar is strong, inflation is low and general economic conditions are stable. In addition, returns on gold related investments have traditionally been more volatile than investments in broader equity or debt markets. Investment in gold and gold related investments may be speculative and may be subject to greater price volatility than investments in other assets and types of companies. There are risks associated with investing in securities of foreign countries, such as erratic market conditions, economic and political instability and fluctuations in currency exchange rates. These risks may be more pronounced with respect to investments in emerging markets. Strategies whose investments are concentrated in a specific industry or sector may be subject to a higher degree of risk than funds whose investments are diversified and may not be suitable for all investors.
Definitions
Federal funds rate is the interest rate at which depository institutions (banks and credit unions) lend reserve balances to other depository institutions overnight on an uncollateralized basis.
Exchange-traded funds (ETFs) are listed investment vehicles that seek to provide exposure to a benchmark, index or actively managed strategy.
MSCI World Index (Net) measures the performance of large and midcap equities across developed markets countries. A net-return index tracks price changes and reinvestment of distribution income net of withholding taxes.
FTSE Gold Mines Index (Price) measures the performance of gold mining companies worldwide that have a sustainable, attributable gold production of at least 300,000 ounces a year and that derive 51% or more of their revenue from mined gold. A price-return index only measures price changes.
S&P 500 Index (Gross/Total) measures the performance of 500 of the top companies in the leading industries of the US economy and is widely recognized as a proxy for the US market as a whole. A total-return index tracks price changes and reinvestment of distribution income.
Nikkei 225 is a price-weighted index composed of 225 stocks in the Prime Market of the Tokyo Stock Exchange. It is widely recognized as a proxy for the Japanese equity market as a whole.
German DAX® Index measures the performance of the 40 largest companies listed on the Frankfurt Stock Exchange that fulfil certain minimum quality and profitability requirements. It is widely recognized as a proxy for the German equity market as a whole.
CAC 40® Index is a free-float market capitalization-weighted index that measures the performance of the 40 largest and most actively traded shares listed on Euronext Paris.
Indexes are unmanaged and do not incur management fees or other operating expenses. One cannot invest directly in an index.
The holdings mentioned herein represent the following total assets of the First Eagle Gold Fund as of 30-Sep-2025: gold bullion 18.57%; Newmont Corporation 6.98%; Agnico Eagle Mines Limited 7.33%; Wheaton Precious Metals Corp 10.82%; Kinross Gold Corporation 4.98%; Pan American Silver Corp Contingent Value Rights 2019-22.02.29 0.05%; Orla Mining Ltd 1.44%; Pan American Silver Corp. 3.51%; Royal Gold, Inc. 3.58%; B2Gold Corp. 1.25%.
Additional Disclosures
This commentary represents the opinion of the First Eagle Gold Fund portfolio managers as of the date noted and is subject to change based on market and other conditions. The opinions expressed are not necessarily those of the entire firm. These materials are provided for informational purposes only. These opinions are not intended to be a forecast of future events, a guarantee of future results or investment advice. Any statistics contained herein have been obtained from sources believed to be reliable, but the accuracy of this information cannot be guaranteed.
The Fund’s portfolio is actively managed and holdings can change at any time. Current and future portfolio holdings are subject to risk.
The Fund may invest in gold and precious metals through investment in a wholly-owned subsidiary of the Fund organized under the laws of the Cayman Islands (the “Subsidiary”). Gold Bullion and commodities include the Fund’s investment in the Subsidiary.
The opinions expressed are not necessarily those of the firm. These materials are provided for informational purposes only. These opinions are not intended to be a forecast of future events, a guarantee of future results or investment advice. Any statistics contained herein have been obtained from sources believed to be reliable, but the accuracy of this information cannot be guaranteed. The views expressed herein may change at any time subsequent to the date of issue hereof.
Third-party marks are the property of their respective owners.
FEF Distributors, LLC (“FEFD”) (SIPC), a limited purpose broker-dealer, distributes certain First Eagle products. FEFD does not provide services to any investor but rather provides services to its First Eagle affiliates. As such, when FEFD presents a fund, strategy or other product to a prospective investor, FEFD and its representatives do not determine whether an investment in the fund, strategy or other product is in the best interests of, or is otherwise beneficial or suitable for, the investor. No statement by FEFD should be construed as a recommendation. Investors should exercise their own judgment and/or consult with a financial professional to determine whether it is advisable for the investor to invest in any First Eagle fund, strategy or product.
Investors should consider investment objectives, risks, charges and expenses carefully before investing. The prospectus and summary prospectus contain this and other information about our funds and may be viewed at www.firsteagle.com. You may also request printed copies by calling us at 800-747-2008. Please read our prospectus carefully before investing.
First Eagle Funds are offered by FEF Distributors, LLC, a subsidiary of First Eagle Investment Management, LLC, which provides advisory services.