Broad macroeconomic uncertainty and interest rate volatility through much of 2023 continued to weigh on the mergers and acquisitions (M&A) activity that fuels direct lending volumes.

Key Takeaways

  • Uncertainty pressured middle market private loan formation in 2023, as macro uncertainty and still-volatile interest rates dampened the M&A activity that drives these loans. Limited new issuance industrywide focused capital deployment on existing borrowers and smaller “add-ons” by private equity sponsors.

  • Demand for asset-based lending was strong during the year, as it tends to be during times when other financing options become less plentiful—a dynamic that was particularly evident in the aftermath of the regional bank challenges.

  • New-loan volumes may increase in 2024 as stabilizing policy rates unleash pent-up M&A activity among private equity sponsors anxious to deploy dry powder.

“Platform” buyouts were especially weak during the year, with private equity sponsors more focused on smaller “add-on” acquisitions. True to its countercyclical nature, asset-based lending (ABL) was a bright spot in the space, providing liquidity providers with diversification alongside compelling return potential.

That said, issuance headwinds are not necessarily an indicator of performance; First Eagle Alternative Credit believes a well-underwritten portfolio can still potentially generate strong returns for investors even if direct lending volume is down, as evident during the years immediately after the global financial crisis. While there were fewer opportunities overall to underwrite new loans in 2023, we believe our volume ultimately outpaced that of the broader market. Meanwhile, the limited new issuance allowed us to focus our attention on our existing borrowers, and providing flexible financing solutions is among the ways lenders generally seek to add value in what ultimately is a very relationship-driven business.

Looking forward, middle market direct lending volume has the potential to improve in 2024 as policy rates perhaps stabilize and private equity sponsors look to put their dry powder to work. Whether or not volumes accelerate, we believe the core middle market, in particular, may offer inherent advantages for nonbank providers of capital able to maintain rigorous loan underwriting and structuring standards.

Uncertainty Weighed on M&A Activity and Direct Lending Pipeline

After a challenging 2022, uncertainty was among the primary concerns facing the US private credit ecosystem—including nonbank lenders like First Eagle Alternative Credit as well as corporate borrowers and the private equity funds that sponsor them—heading into 2023. With inflation at a multidecade high and showing no indications of easing on its own, the Federal Reserve in March 2022 embarked on an interest rate-hike campaign that to date has increased the policy rate by 525 basis points and has done so at the most rapid pace ever. Significant rate volatility ensued as markets sought to divine the duration and trajectory of Fed tightening and the odds that the central bank would be able to tame inflation without tipping the economy into recession (the much-desired “soft landing”). Biased higher even before the Fed’s policy pivot, the ICE BofAML MOVE Index—which measures US interest rate volatility—accelerated its climb in 2022 and ultimately peaked in March 2023 with the bankruptcies of several US regional banks. Though it has subsequently eased, rate volatility remains elevated relative to historical levels.

Not surprisingly, these conditions have not been very supportive of the M&A activity that serves as a major feeder to the direct lending pipeline. Private equity dealmaking, by both count and value, has declined in six of the past seven quarters and is down sharply from its 2021 peak, as shown in Exhibit 1. “Platform” buyouts—in which a private equity firm acquires a business that it intends to expand over time through the purchase of multiple smaller businesses (a.k.a. a “buy and build” strategy)—were particularly weak in the more conservative dealmaking environment, as they are typically relatively large in size and entail a fair amount of leverage. With interest rates discouraging prospective buyers from offering the type of price multiples that were common on these deals a few years ago, many private equity firms instead have opted to hold their portfolio names in hopes that conditions become more hospitable rather than exit at valuations they consider subpar.

Exhibit 1. Weak Private Equity Dealmaking Continued to Weigh on Direct Lending Volumes
US Private Equity Middle-Market Deal Activity, 2014 through September 2023

FEAC Exhibit 4

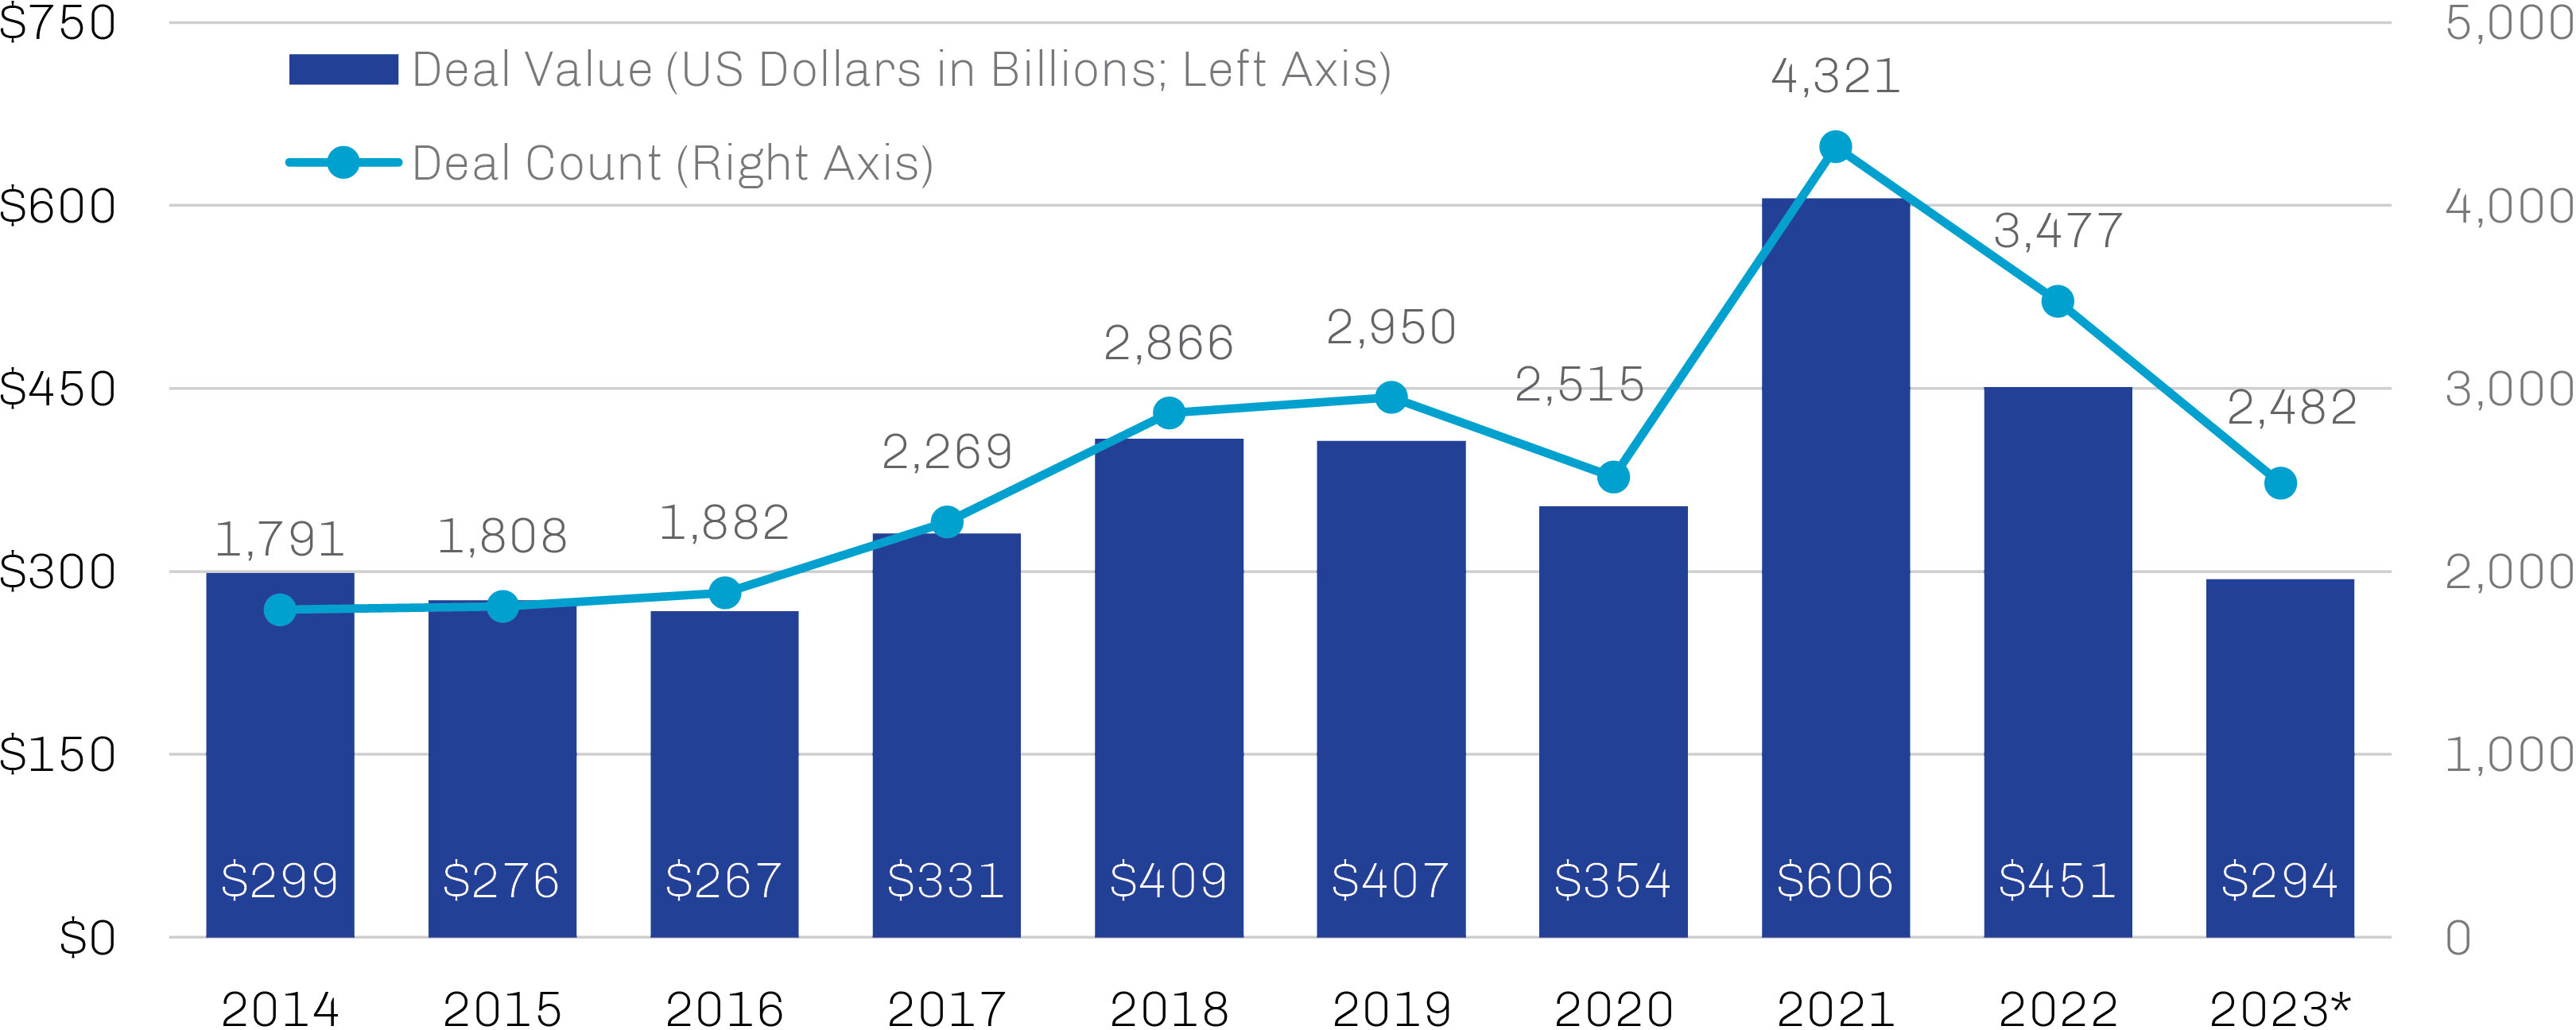
* Year-to-date through September 30, 2023; deal count is PitchBook estimate.
Source: PitchBook; data as of September 30, 2023.

In contrast, “add-ons”—the smaller acquisitions that are assimilated into a sponsor’s platform company— continued to provide private equity sponsors a way to deploy capital, albeit in smaller chunks, as they wait for markets to be more amenable to larger deals. Sponsors have continued to demonstrate a willingness to invest in their platform businesses, especially those platforms with decent capital structures and credit lines locked in at more attractive pre-2022 terms. While there are some incremental costs to the platform borrower as lenders extract small concessions, add-ons typically are a far more efficient financing mechanism than a recapitalization. Industrywide, add-ons accounted for about 76% of all private equity-sponsored buyouts in both 2022 and through the first three quarters of 2023.1

Though Other Forms of Financing Slowed, Asset-Based Lending Was Strong

First Eagle Alternative Credit focuses its direct lending activities on the US sponsored core middle market, which we define as companies with annual EBITDA of around $10–75 million. Despite the headwinds described earlier, the core middle market has been resilient even amid challenging conditions for issuance, and the past decade has seen remarkable growth in the space. Rising private company valuations have prompted private equity sponsors to look toward the smaller end of the middle market for more cost-effective platform opportunities; in our view, the lower middle market currently has a more balanced supply/demand dynamic, which has provided managers greater opportunities for diversification on behalf of clients.

While there were fewer opportunities overall to underwrite new loans in 2023, we expect our volume ultimately to outpace that of the broader market during the year based on deals booked and committed through year-end. Meanwhile, the limited new issuance allowed us to focus our attention on our existing borrowers, and add-ons—as they did for the market as a whole—represented the majority of our capital deployment during the year. We don’t view this as a negative. A well-underwritten portfolio can still generate strong returns for investors even if volume is down, as we saw in the years immediately after the global financial crisis, for example. Moreover, private lending is a relationship-driven business at the end of the day, and the ability to provide flexible financing solutions for our sponsors without compromising our stringent underwriting standards is among the ways we add value to these relationships. It’s been our experience that strong relationships with sponsors can help support consistent deal flow over time, even when markets in general appear unstable.

As a complement to cash flow-based loan underwriting, our robust asset-based lending (ABL) capability provides diversification to our platform and to our investors. Secured by specific assets of the borrower—such as inventory, accounts receivable, real estate, machinery and equipment, and intellectual property—ABL facilities generally appeal to companies with high working-capital needs and substantial assets but also inconsistent cash flows that limit access to other types of financing; examples include retailers that maintain large inventories or industrials renting high-capex equipment.

Demand for ABL historically has been countercyclical. Though the need for these facilities is always present to some extent, borrower interest tends to increase when other financing options grow scarce—a dynamic that was evident during the year, particularly in the aftermath of the regional bank challenges.

We Believe Ample Capital Remains to be Deployed

Though dealmaking has been challenged for much of the past 18 months, there are signs the leveraged-buyout space may be thawing. We wouldn’t necessarily describe the mood of private equity sponsors as upbeat, but we’ve seen new-issue activity pick up as sponsors appear less anxious about worst-case outcomes for the economy and more confident that policy rates have stabilized. The potential release of pent-up M&A energy bodes well for new-loan volumes ahead, especially given the amount of private equity dry powder waiting for a target, as shown in Exhibit 2 below; putting more than $2.5 trillion of dry powder to work on acquisitions at a conservative loan-to-value ratio of 50% would require $1.25 trillion of private credit capital. Meanwhile, add-on volume seems likely to persist as lenders and sponsors continue to manage their existing portfolios, and refinancings may even come back into play if rates ease, as futures markets currently forecast.

Exhibit 2. Massive Amount of Private Equity Dry Powder May Support Direct Lending Pipeline
US Dollars in Billions, 2014 through October 2023

FEAC Exhibit 4

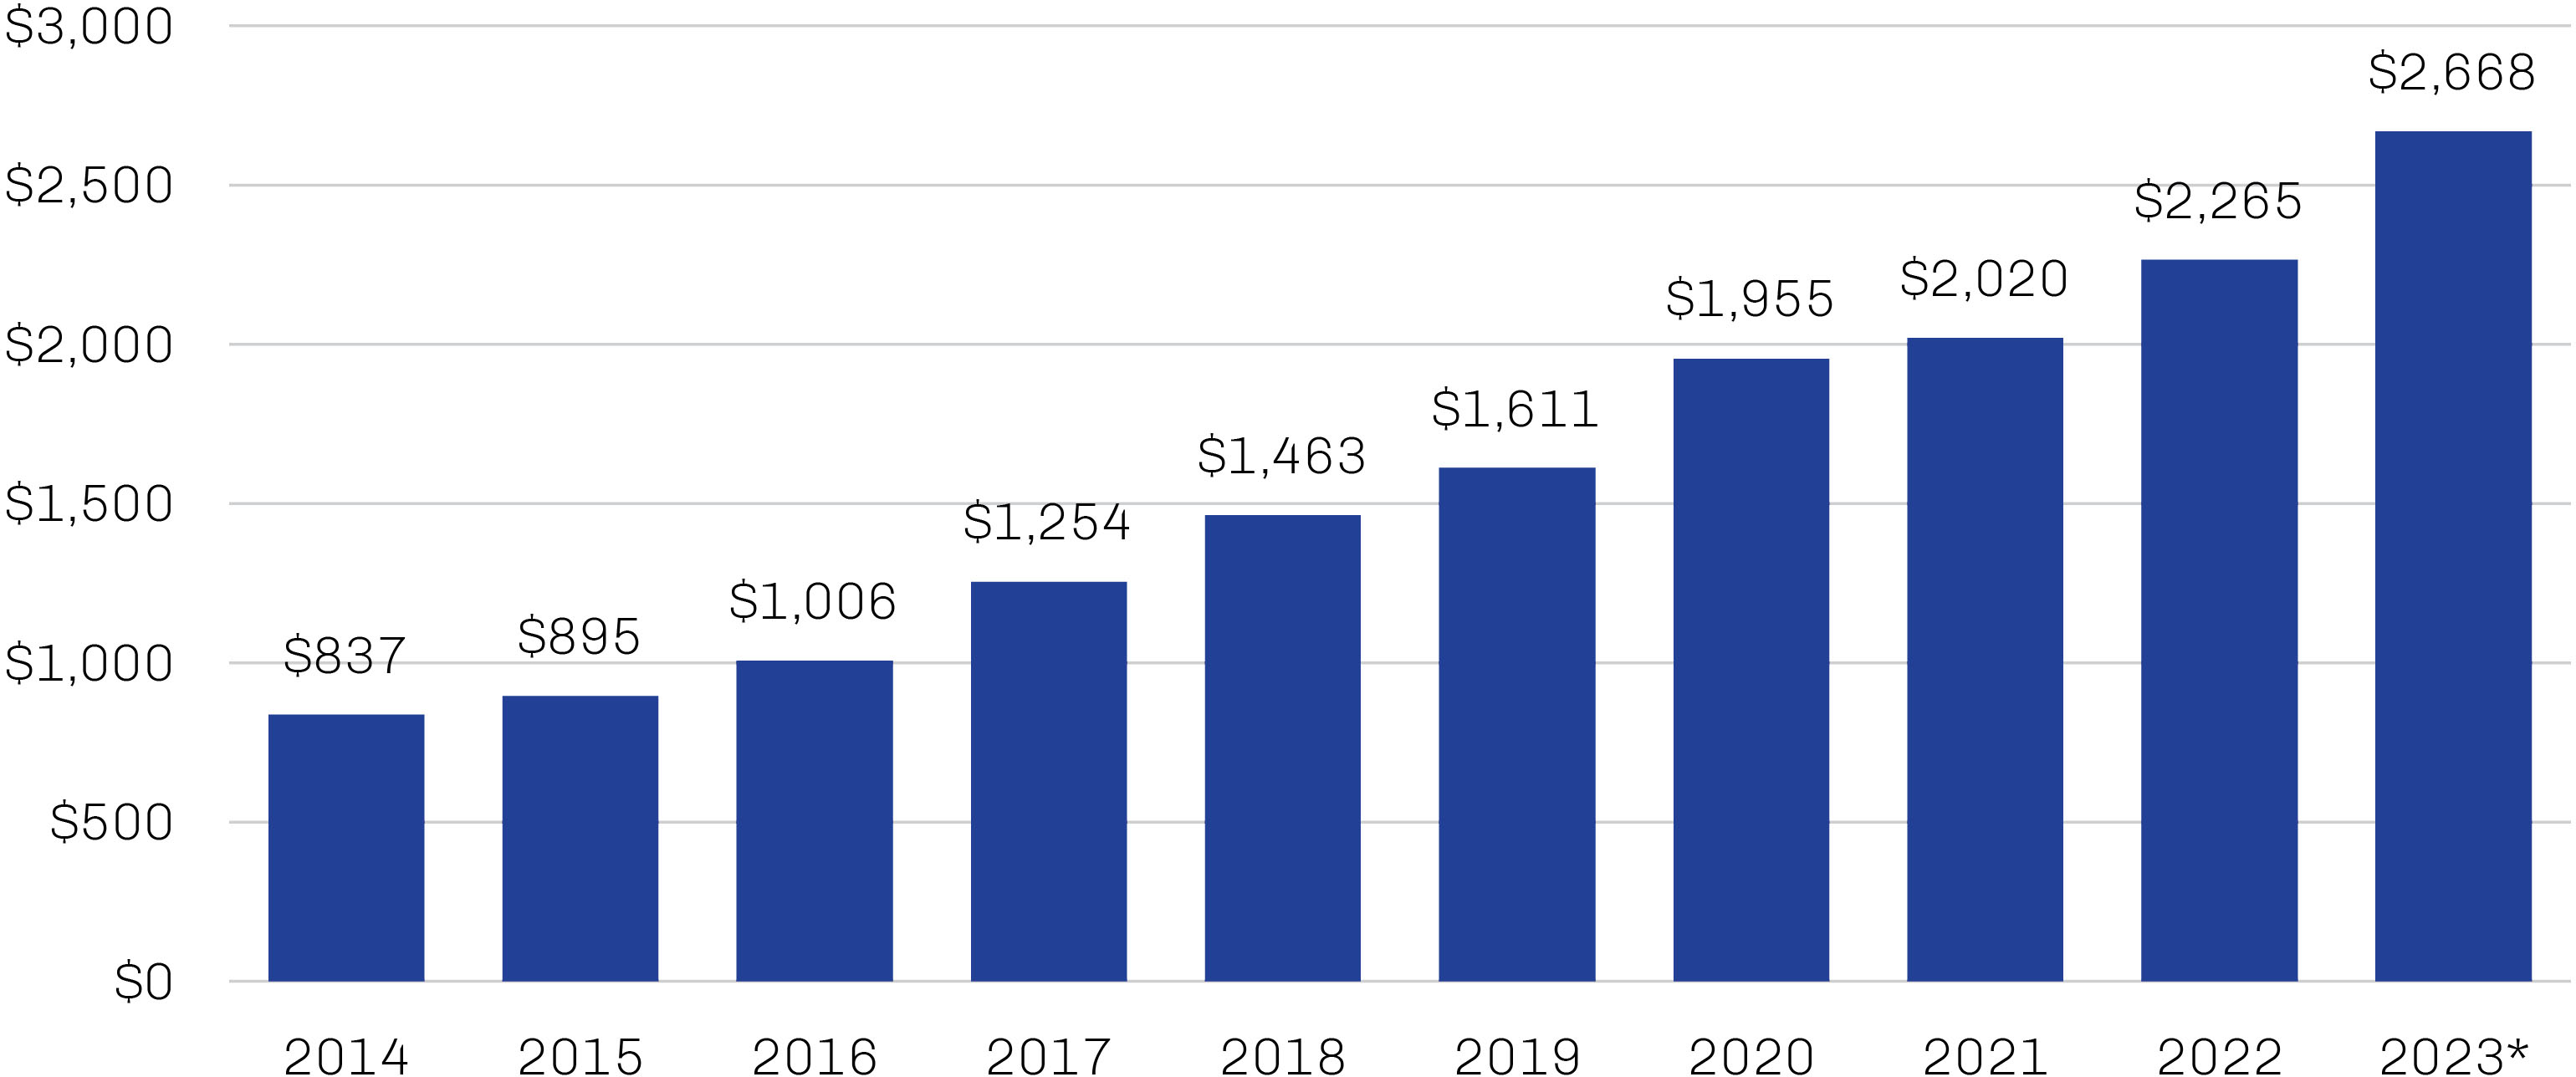
* Year-to-date through October 30, 2023
Source: Preqin; data as of December 11, 2023.

In certain verticals, we have already seen sponsors begin to lay the groundwork for deals they hope to close in early 2024. This includes segments within healthcare, where sponsors have been waiting for portfolio company operations to normalize from Covid-19; the pandemic disrupted many high-margin activities within healthcare and unleashed significant wage-cost pressures on what is a very labor-intensive industry, weighing on margins. A stabilization in debt markets and easing labor costs may provide attractive exit opportunities for sponsors of certain healthcare companies. Technology is another people-heavy sector in which sponsors may be eager to strike a deal and return some capital to their limited partners. 

Be True

Direct lending as an industry has a track record of opportunism. Nonbank lenders emerged in earnest following the global financial crisis because traditional banks were limited in their ability to provide liquidity, and these lenders continue to scour the credit market for capital needs that are not being met by the traditional participants.

Recently, a number of larger private lenders have attempted to put their ample capital stores to work by moving into deal sizes usually associated with broadly syndicated loans, stealing share by offering speed and certainty of funding during periods when more complicated financing structures are bogged down in disruptions, as was the case with the onset of Covid-19 in 2020 or the regional bank crisis earlier this year. In effect, these transactions refinance public debt as private debt, with the attendant decrease in liquidity for investors but little or no change in the credit profile of the borrower. Moreover, the overwhelmingly covenant-lite nature of the leveraged loan market suggests that competing private structures may need to make compromises on contractual provisions to compete for these deals consistently. It will be interesting to see what impact the competition between public and private structures may have on the risk/return profiles of such debt, especially if traditional private credit deal flow remains challenged.

Whether or not deal activity improves in 2024, it’s likely there will still be opportunities to potentially generate good risk-adjusted returns in the core middle market when the right borrower, sponsor and lender intersect. While we believe the core middle market offers inherent advantages for nonbank providers of capital, including diversification potential, it ultimately comes down to the quality of underwriting. For us, that has meant targeting borrowers with stable historical earnings, strong cash flows and private equity sponsorship, and mitigating risk through a first-lien position in the borrower’s capital structure complemented by at least one financial covenant and/or liquidity test.


1. Source: PitchBook; data as of September 30, 2023.

The opinions expressed are not necessarily those of the firm. These materials are provided for informational purposes only. These opinions are not intended to be a forecast of future events, a guarantee of future results, or investment advice. Any statistics contained herein have been obtained from sources believed to be reliable, but the accuracy of this information cannot be guaranteed. The views expressed herein may change at any time subsequent to the date of issue hereof. The information provided is not to be construed as a recommendation to buy, hold or sell or the solicitation or an offer to buy or sell any fund or security.

Past performance is not indicative of future results.

Risk Disclosures

All investments involve the risk of loss of principal.

There are risks associated with investing in securities of foreign countries, such as erratic market conditions, economic and political instability and fluctuations in currency exchange rates.

A principal risk of investing in value stocks is that the price of the security may not approach its anticipated value or may decline in value. “Value” investments, as a category, or entire industries or sectors associated with such investments, may lose favor with investors as compared to those that are more “growth” oriented.

The value and liquidity of portfolio holdings may fluctuate in response to events specific to the companies or markets, as well as economic, political or social events in the US or abroad. During periods of market volatility, the value of individual securities and other investments at times may decline significantly and rapidly. The securities of small and micro-size companies can be more volatile in price than those of larger companies and may be more difficult or expensive to trade.

Investment in gold and gold-related investments present certain risks, including political and economic risks affecting the price of gold and other precious metals, like changes in US or foreign tax, currency or mining laws, increased environmental costs, international monetary and political policies, economic conditions within an individual country, trade imbalances, and trade or currency restrictions between countries. The price of gold, in turn, is likely to affect the market prices of securities of companies mining or processing gold and, accordingly, the value of investments in such securities may also be affected. Gold-related investments as a group have not performed as well as the stock market in general during periods when the US dollar is strong, inflation is low and general economic conditions are stable. In addition, returns on gold-related investments have traditionally been more volatile than investments in broader equity or debt markets. Investment in gold and gold-related investments may be speculative and may be subject to greater price volatility than investments in other assets and types of companies.

Diversification does not guarantee investment returns and does not eliminate the risk of loss.

Alternative Investment Risks
Alternative investments can be speculative and are not suitable for all investors. Investing in alternative investments is only intended for experienced and sophisticated investors who are willing and able to bear the high economic risks associated with such an investment. Investors should carefully review and consider potential risks before investing. Certain of these risks include:

  • Loss of all or a substantial portion of the investment;
  • Lack of liquidity in that there may be no secondary market or interest in the strategy and none is expected to develop;
  • Volatility of returns;
  • Interest rate risk;
  • Restrictions on transferring interests in a private investment strategy;
  • Potential lack of diversification and resulting higher risk due to concentration within one or more sectors, industries, countries or regions;
  • Absence of information regarding valuations and pricing;
  • Complex tax structures and delays in tax reporting;
  • Less regulation and higher fees than mutual funds;
  • Use of leverage, which magnifies the potential for gain or loss on amounts invested and is generally considered a speculative investment technique and increases the risks associated with investing in the strategy;
  • Carried interest, which may cause the strategy to make more speculative, higher-risk investments than would be the case in absence of such arrangements; and
  • Below investment grade loans, which may default and adversely affect returns

Asset-based lending (ABL) is corporate borrowing supported by specific assets of the borrower.

The Conference Board Leading Economic Index (LEI) is a composite index of economic and market variables that aims to identify potential turning points in the business cycle.

Credit-risk transfers (CRTs) are transactions that transfer the credit risk of all or a tranche of a portfolio of financial assets.

Duration is a measure of the sensitivity of the price of a bond or other debt instrument to a change in interest rates.

Fitch Ratings is a nationally recognized statistical rating organization (NRSRO) registered with the SEC that provides credit rating as an assessment of credit worthiness of an issuer with respect to debt obligations, including specific securities, money market instruments or other bonds. Ratings are measured on a scale that generally ranges from AAA (highest) to D (lowest); ratings are subject to change without notice. Not Rated (NR) indicates that the debtor was not rated and should not be interpreted as indicating low quality.

Government-sponsored enterprises (GSEs) were established and chartered by the US federal government for public policy purposes. They are private companies, and their securities are not backed by the full faith and credit of the federal government.

Mortgage-backed securities (MBS) are financial instruments collateralized by pools of mortgages.

Personal consumption expenditures (PCE) price index is a measure of consumer spending on goods and services among households in the US.

Indexes are unmanaged and one cannot invest directly in an index.

ICE BofA MOVE Index is a measure of US interest rate volatility. It is a yield curve-weighted index of the normalized implied volatility on one-month Treasury options.

MSCI China Index (Net) measures the performance of large and midcap representation across China A shares, H shares, B shares, Red chips, P chips and foreign listings. A net-return index tracks price changes and reinvestment of distribution income net of withholding taxes.

MSCI EAFE Index (Net) measures the performance of large and midcap securities across 21 developed markets countries around the world, excluding the US and Canada. A net-return index tracks price changes and reinvestment of distribution income net of withholding taxes.

MSCI World Index (Net) measures the performance of large and midcap securities across 23 developed markets countries around the world. A net-return index tracks price changes and reinvestment of distribution income net of withholding taxes.

Russell 1000® Growth Index (Gross/Total) measures the performance of the large-cap growth segment of the US equity universe. It includes those Russell 1000 companies with higher price-to-value ratios and higher forecasted growth values. A total-return index tracks price changes and reinvestment of distribution income.

Russell 1000® Value Index (Gross/Total) measures the performance of large-cap value segment of the US equity universe. It includes those Russell 1000 companies with lower price-to-book ratios and lower forecasted growth values. A total-return index tracks price changes and reinvestment of distribution income.

Russell 2000® Index (Gross/Total) measures the performance of the small-cap segment of the US equity universe. It includes approximately 2,000 of the smallest securities based on a combination of their market cap and current index membership. A total-return index tracks price changes and reinvestment of distribution income.

S&P 500 Index (Gross/Total) is a widely recognized unmanaged index including a representative sample of 500 leading companies in leading sectors of the US economy. Although the S&P 500 Index focuses on the large-cap segment of the market, with approximately 80% coverage of US equities, it is also considered a proxy for the total market. The S&P 500 includes dividends reinvested. A total return index tracks price changes and reinvestment of distribution income.

Large Blend Morningstar Category: Large blend portfolios are fairly representative of the overall US stock market in size, growth rates and price. Stocks in the top 70% of the capitalization of the US equity market are defined as large cap. The blend style is assigned to portfolios where neither growth nor value characteristics predominate. These portfolios tend to invest across the spectrum of US industries and, owing to their broad exposure, the portfolios’ returns are often similar to those of the S&P 500 Index.

Large Growth Morningstar Category: Large growth portfolios invest primarily in big US companies that are projected to grow faster than other large cap stocks. Stocks in the top 70% of the capitalization of the US equity market are defined as large cap. Growth is defined based on fast growth (high growth rates for earnings, sales, book value and cash flow) and high valuations (high price ratios and low dividend yields). Most of these portfolios focus on companies in rapidly expanding industries

Large Value Morningstar Category: Large value portfolios invest primarily in big US companies that are less expensive or growing more slowly than other large cap stocks. Stocks in the top 70% of the capitalization of the US equity market are defined as large cap. Value is defined based on low valuations (low price ratios and high dividend yields) and slow growth (low growth rates for earnings, sales, book value and cash flow).

Small Blend Morningstar Category: Small blend portfolios favor US firms at the smaller end of the market-capitalization range. Some aim to own an array of value and growth stocks, while others employ a discipline that leads to holdings with valuations and growth rates close to the small cap averages. Stocks in the bottom 10% of the capitalization of the US equity market are defined as small cap. The blend style is assigned to portfolios where neither growth nor value characteristics predominate.

Small Growth Morningstar Category: Small growth portfolios focus on faster-growing companies whose shares are at the lower end of the market-capitalization range. These portfolios tend to favor companies in up-and-coming industries or young firms in their early- growth stages. Because these businesses are fast-growing and often richly valued, their stocks tend to be volatile. Stocks in the bottom 10% of the capitalization of the US equity market are defined as small cap. Growth is defined based on fast growth (high growth rates for earnings, sales, book value and cash flow) and high valuations (high price ratios and low dividend yields).

Small Value Morningstar Category: Small value portfolios invest in small US companies with valuations and growth rates below other small-cap peers. Stocks in the bottom 10% of the capitalization of the US equity market are defined as small cap. Value is defined based on low valuations (low price ratios and high dividend yields) and slow growth (low growth rates for earnings, sales, book value and cash
flow).

FEF Distributors, LLC (“FEFD”) (SIPC), a limited purpose broker-dealer, distributes certain First Eagle products. FEFD does not provide services to any investor, but rather provides services to its First Eagle affiliates. As such, when FEFD presents a fund, strategy or other product to a prospective investor, FEFD and its representatives do not determine whether an investment in the fund, strategy or other product is in the best interests of, or is otherwise beneficial or suitable for, the investor. No statement by FEFD should be construed as a recommendation. Investors should exercise their own judgment and/or consult with a financial professional to determine whether it is advisable for the investor to invest in any First Eagle fund, strategy or product.

First Eagle Investments is the brand name for First Eagle Investment Management, LLC and its subsidiary investment advisers.

©2024 First Eagle Investment Management, LLC. All rights reserved.