


The Direct Route
The Direct Route

Q: What drove middle market direct lending during 2022?
Chris: Merger and acquisition (M&A) activity—which in the middle market is typically sponsored by a private equity firm—is a key source of demand for direct lenders’ capital. The very high inflation, rising interest rates and slowing economic growth we saw during 2022 introduced significant volatility to the public financial markets and also weighed on M&A deal flow. M&A volume in the US has declined for five consecutive quarters after peaking
in second quarter 2021, and the pace of deals through the first three quarters of 2022 was down by nearly one-third compared with 2021.1 While this has meant fewer underwriting opportunities, an uncertain environment tends to favor direct lenders over other forms of leveraged finance given their ability to close deals more quickly and with greater certainty of terms than is possible with high yield bonds or syndicated loans.
Looking at First Eagle Alternative Credit’s direct lending book, we are on track to extend over $1 billion of loans to US middle market companies in 2022—significantly lower than our deployment in 2021 but on par with 2020. A decent year, in my view, even as the nature of our deals shifted somewhat. While volumes in 2021 were dominated by private equity sponsors financing new transactions, 2022 has been more about sponsors building on previous platform investments through targeted acquisitions and supporting existing portfolio companies.
Q: How did volatility in the public credit markets during 2022 affect the pricing of middle market loans?
Michelle:
The challenges facing public fixed income markets took time to trickle into the middle market. This lag is not unusual, in our experience, as a largely nonexistent secondary market for these facilities and their directly originated nature has tended to somewhat insulate them from fluctuations in the public space.
Yields and spreads on high yield bonds and leveraged loans bottomed in January and broke durably higher in April, but we didn’t really see much in the way of widening in directly originated middle market loans until June or so. Even then, I’d estimate prices widened only about 70–100 basis points through the end of November. All-in yields saw a more meaningful increase, however, driven by higher reference rates and larger original issue discounts (OIDs)—i.e., the difference between a loan’s par value and the price at which it is issued. OIDs offered on new loans widened to about 2.5% from the 2.0% that had been more typical.2
Upfront concessions like OIDs improve the economics of the deal from a lender’s perspective, and the rising OIDs we have seen of late suggest a rationing of credit may be underway. Deals are still getting done, but the fairway is narrow. Risk-sensitive lenders are focused on the most pristine opportunities—facilities with lower loan-to-value ratios extended to noncyclical businesses—and generally are wary of businesses dependent on healthy consumer-demand dynamics and discretionary-spending trends.

Risk-Sensitive Direct Lenders Have Sought Pristine Deals Amid a Volatile Backdrop
Observed New Third-Party M&A Buyouts
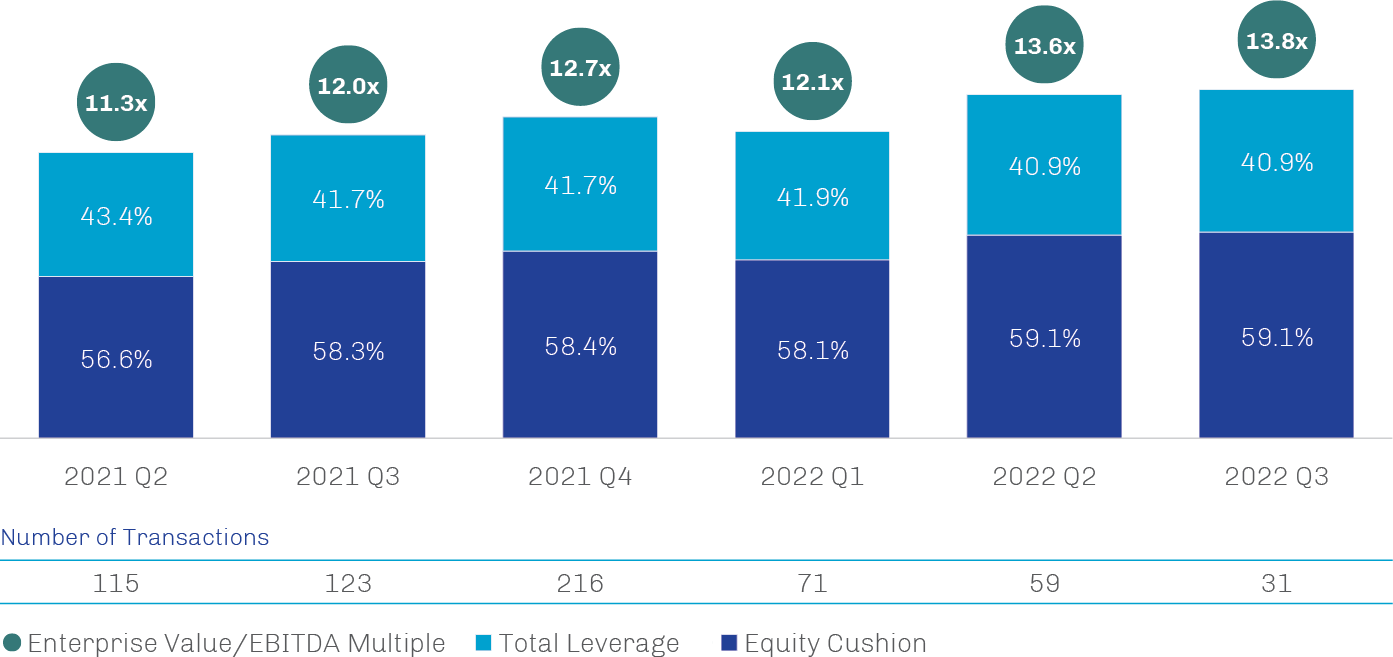
Source: Lincoln International; data as of November 1, 2022
Chris:
We focus our origination efforts on a handful of market verticals—business services, consumer, financial services, healthcare and technology—and further sharpen our attention within those verticals to a subset of industries that tend to be less cyclically exposed. From a go-forward perspective, our approach hasn’t changed; within our areas of specialization, we will continue to collaborate with private equity sponsors to provide creative financing solutions rooted in deep due diligence.
While not an industry per se, asset-based lending (ABL) may represent an opportunity to put capital to work for an attractive risk-adjusted return right now, in our view. Traditional middle market financing solutions like direct lending and broadly syndicated loans are underwritten based on an assessment of the borrower’s cash flows. ABL facilities, in contrast, are secured by specific assets of the borrower—such as inventory, accounts receivable, real estate, machinery and equipment, and intellectual property—and thus provide a specific source of collateral the lender may tap should the need arise. These loans often appeal to companies that have high working capital needs and substantial assets but also inconsistent cash flows that limit access to other types of financing; think retailers that maintain large inventories or industrials renting high-capex equipment.
In July 2020, we hired Larry Klaff and Lisa Galeota from Gordon Brothers Finance Company to drive our ABL efforts. With more than 45 years combined in the space, Larry and Lisa have significant experience appraising different types of collateral assets and underwriting loans across market cycles. Given the heightened uncertainty in the market, we expect demand for ABL structures to remain robust.
Q: What do you expect for 2023?
Michelle:
Current economic trends suggest that the environment for M&A activity—and thus new loans issued to finance these transactions—is likely to remain muted in 2023, with add-on activities by our existing borrowers continuing to dominate volume as it had in 2022. The slowing economy should weigh on the enterprise value of middle market companies while their cost of capital remains elevated, resulting in lower leverage ratios on new deals. As long as the environment remains somewhat unstable, it’s difficult to see an impetus for a significant rebound in transaction volume. Lower volumes aren’t the end of the world, however; a well-underwritten portfolio in the low-volume years following the global financial crisis still generated strong returns.3
In addition, I think the tenor on loans likely will remain extended, as higher rates deter refinancing and subdued valuations serve as a roadblock to the initial public offering market. This isn’t necessarily a bad thing; in fact, the extension of these credits, assuming they continue to perform, can be beneficial and help drive a bigger multiple of capital. We can’t just go out into the primary market and recreate our current book of loans; we’re happy to get paid on existing credits, and their floating interest rates will help keep them competitive with the prevailing market yields.
Moreover, we are thoughtful about how we structure loans. While some direct lenders have followed the BSL industry down the path of “covenant-lite” loans, we strive to incorporate at least one financial covenant and/ or liquidity test in all of our directly originated loans, whether cash flow-based or asset-based. For cash flowbased loans, this typically is a leverage covenant, sometimes accompanied by a fixed charge covenant. Over the past several months, we’ve witnessed the value added by these contractual provisions, as a tripped covenant has allowed us to renegotiate a loan’s pricing and structure in a way that improved our economics. Though the coupons on the floating-rate loans we write reset every 30 to 90 days, it’s always nice to be able to pick up incremental yield in advance.
Chris:
To me, the environment feels much more uncertain now than it did in the immediate aftermath of the Covid outbreak. Back then, the Federal Reserve’s massive intervention gave us time to let nature take its course, even though we couldn’t foresee the timing around a return to more-normal economic conditions. Today, it’s hard to see a specific catalyst to get us back to “normal.” I’m sure that the market at some point will find the level at which the deal economics work for borrowers, lenders and sponsors, and then it will be off to the races again. This might even happen sometime in 2023, but it’s hard to offer anything other than gut instinct here.
But this is why we maintain our stringent underwriting standards in good markets and bad. We’re not going to lend money just for the sake of it.
Michelle:
A weakening macroeconomic backdrop is always unsettling for lenders, but, in our view, those who should be most nervous are 1) lenders that have never experienced difficult market conditions before, and 2) lenders that were positioned too aggressively into the downturn.
First Eagle Alternative Credit has decades of experience providing capital in the middle market space, and our credit selection and risk management processes have been honed across multiple macroeconomic regimes. It’s because of our experience with disparate credit environments that we seek to apply rigorous due diligence and careful structuring in pursuit of strong returns while also attempting to mitigate downside risk.
Chris:
To Michelle’s point, you can’t be reactive to prevailing conditions in the illiquid direct lending market; once the environment begins to deteriorate, it may be too late to change course. We believe our efforts in recent years to move toward loans higher in the capital stack—and toward first-lien debt, in particular—should mitigate downside risk in the event the macroeconomic backdrop continues to soften and position us to seek out potential opportunities as they emerge.
1. Source: Lincoln International; data as of November 1, 2022.
2. Source: Leveraged Commentary & Data (LCD); data as of November 30, 2022.
3. Cliffwater, Leveraged Commentary & Data (LCD); data as of November 30, 2022.